Published: 2026-10-22T04:09:46.000Z
Chart USD/CNH Update: Still leaning lower
1
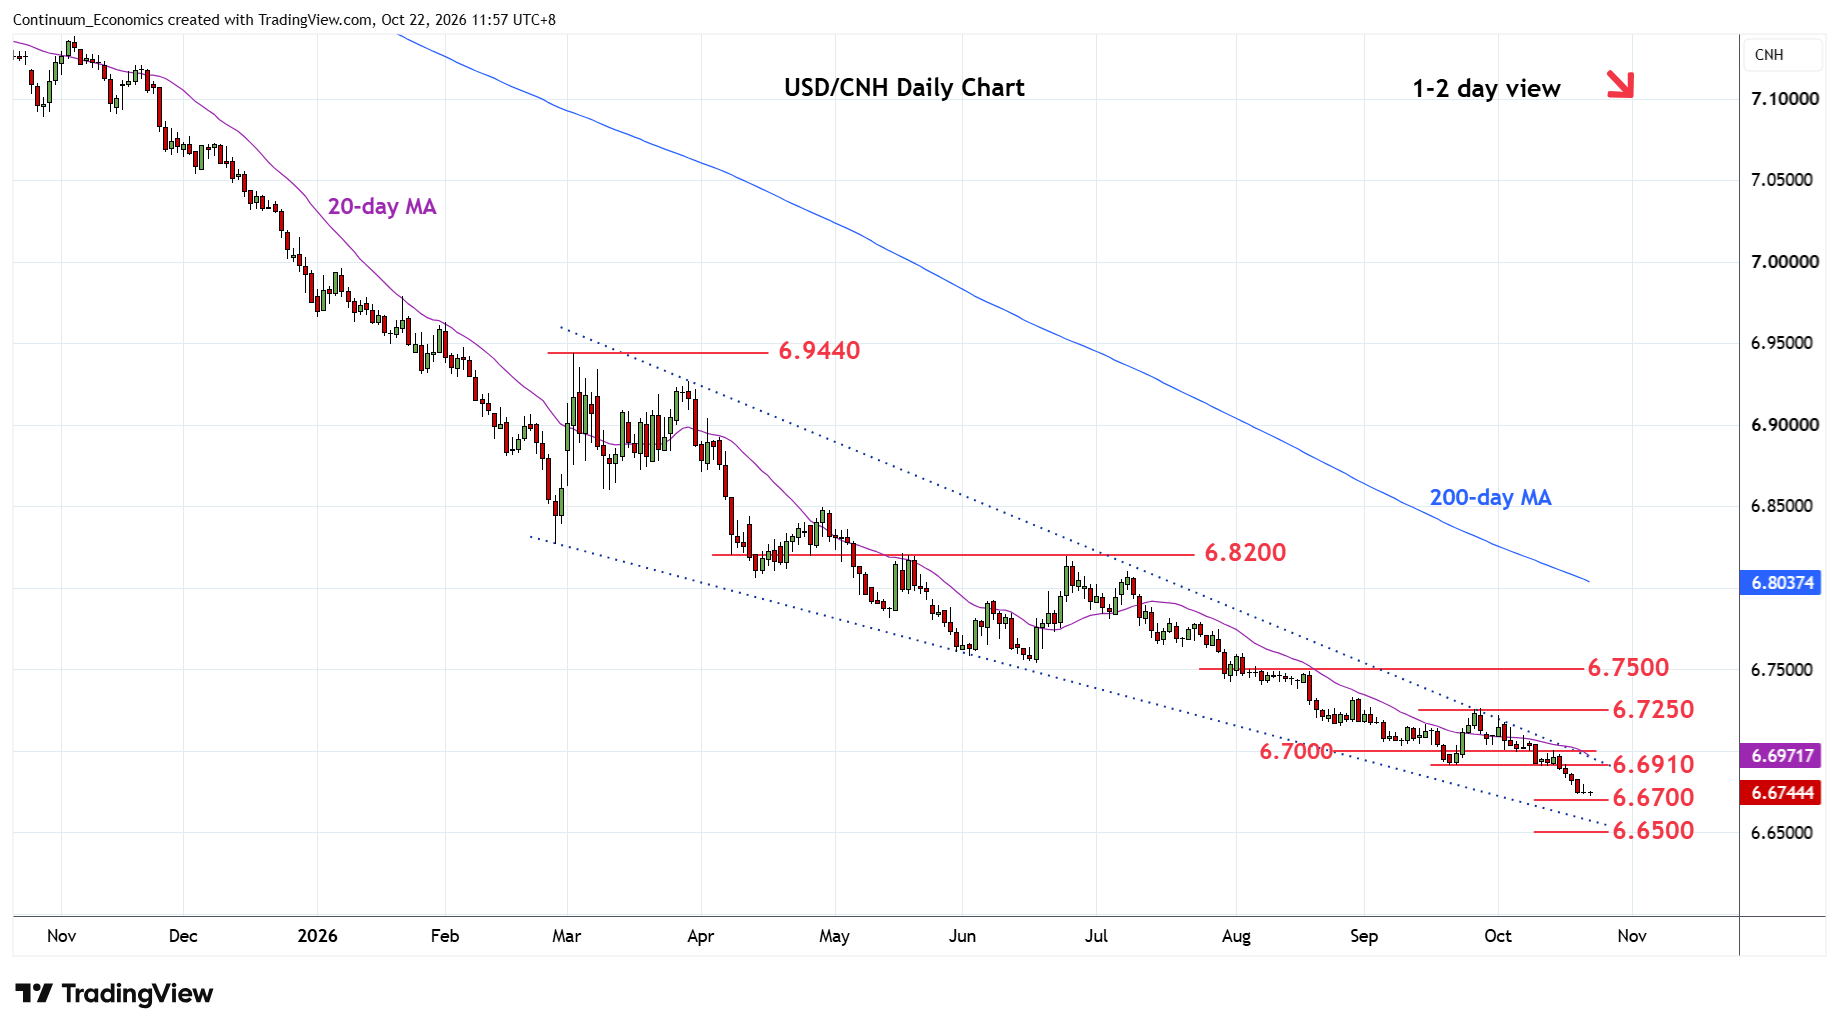
Remains under pressure but bearish momentum slows as prices extend deep into oversold areas on daily chart
| Level | Imp | Comment | Level | Imp | Comment | |||
|---|---|---|---|---|---|---|---|---|
| R4 | 6.7400 | * | 7 Aug low, congestion | S1 | 6.6700 | ** | 2023 year low | |
| R3 | 6.7250 | * | congestion | S2 | 6.6500 | * | congestion | |
| R2 | 6.7000 | * | figure | S3 | 6.6160 | * | Jun 2022 low | |
| R1 | 6.6910 | ** | Sep low | S4 | 6.6000 | ** | figure |
Asterisk denotes strength of level
04:00 GMT - Remains under pressure but bearish momentum slows as prices extend deep into oversold areas on daily chart. Nearby see strong support at the 6.6700, 2023 year low. Below here will see scope for extenion to the 6.6500 congestion. However, divergence remains on the weekly studies and caution corrective bounce. Meanwhile, resistance remains at the 6.6910 low of September and this extend to the 6.7000 level. This area is expected to cap and only lift over this area will ease the downside pressure and see room for stronger corrective bounce to the 6.7200/6.7250 area.