2026 Q1 Country Insights Scores to Download in Excel
The Country Insights (CI) Model is a comprehensive quantitative tool for assessing country and sovereign risk, measuring a country’s exposure to external and domestic financial shocks and its capacity to grow. Our full range of scores across 174 countries for the first quarter of 2026 is now available; the dataset allows comparison across periods and ranks all countries on the headline indicators, with each metric provided as an accessible time series.
The CI Model generates three main composite indexes, namely Investment Attractiveness, Sovereign Risk, and Country Strength, built on four underlying pillars: external adjustment capacity, institutional strength, medium-term growth prospects, and social inclusion. Alongside these, the model produces a series of additional indicators capable of flagging structural vulnerabilities to specific external shocks, including the oil-shock vulnerability indicator, which gains particular relevance in the current context of the Iran conflict.
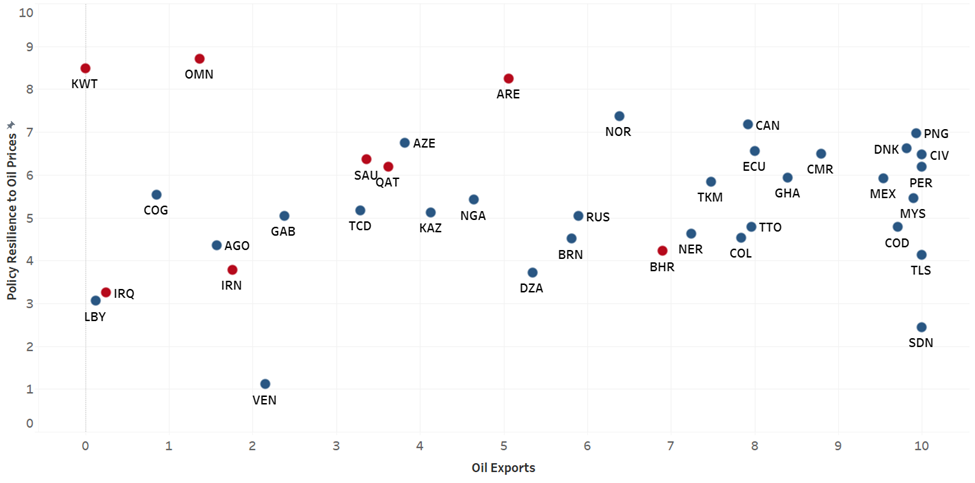
Every oil-exporting sovereign carries two structural features that determine how it copes with swings in the oil market: how much of its economy depends on oil, and how prepared it is to absorb a shock to its oil revenue. The oil-shock vulnerability indicator, which covers more than forty oil-producing economies ranging from Norway and Canada to Venezuela and Nigeria, measures exactly this. Built on two components and rescaled from 0 (total dependence) to 10 (none), it shows how well each country is set up to handle an oil shock. The 2026 Iran conflict and the closure of the Strait of Hormuz provide a vivid backdrop against which to read these scores, with each Gulf exporter showing in real conditions what its underlying score describes.
Figure 1. Reliance and Resilience Scores Across Oil-exporting Economies
Source: Continuum Economics
The indicator’s strength lies in its two-part construction. The first component, an oil-exposure measure, captures direct reliance, looking at net oil exports as a share of GDP and of total exports. The second, a policy-resilience measure, captures readiness for a price shock through fiscal balance, indebtedness, monetary flexibility, and sovereign risk. Together they describe how heavily a country leans on oil and how much cushion it holds when the oil market moves. Looking across the wider sample, the contrast is striking. Diversified, well-buffered economies such as Norway, Denmark, and Canada sit at the higher end of the scale, while heavily oil-dependent economies with concentrated export bases occupy the lower reaches. The Gulf exporters fall in distinctive positions on this map, anticipating in structural terms how each would meet a shock.
Within this sample, the Gulf is where the 2026 shock has landed most directly, and four exporters stand out: Saudi Arabia, Kuwait, Oman, and Qatar. Among these, Kuwait and Oman emerge as some of the most oil-exposed, with Kuwait sitting at the very floor of the exposure scale. Set against that exposure, both rank among the strongest on resilience, with solid sovereign reserves, low debt, and ample fiscal room. These are economies that lean hard on oil but are well-equipped to ride out a shock to it. Saudi Arabia and Qatar register as more diversified, with mid-range exposure and solid buffering, making them sovereigns built to bend with the oil market rather than be thrown by it. Across all four, the scores describe substantial oil reliance paired with real and measurable capacity to absorb disruption, and they do so before any crisis arrives.
The 2026 shock created the conditions under which these structural readings could be observed in real terms. When Hormuz effectively closed from late February, the IEA recorded the largest supply disruption in the history of the global oil market, with output from affected Gulf producers falling well below pre-war levels and Brent temporarily surging above USD 120 a barrel. In a shock of this kind, lower export volumes do not necessarily translate into lower revenue. When prices rise sharply enough, a country exporting fewer barrels can still see its oil receipts hold steady or even grow, while a country forced to shut in production heavily may see volumes fall faster than prices can compensate. The scores describe where each country starts from, and the data that follows shows how that starting position interacts with the actual shape of the disruption. Read together, they give a fuller picture of how each Gulf exporter is being affected.
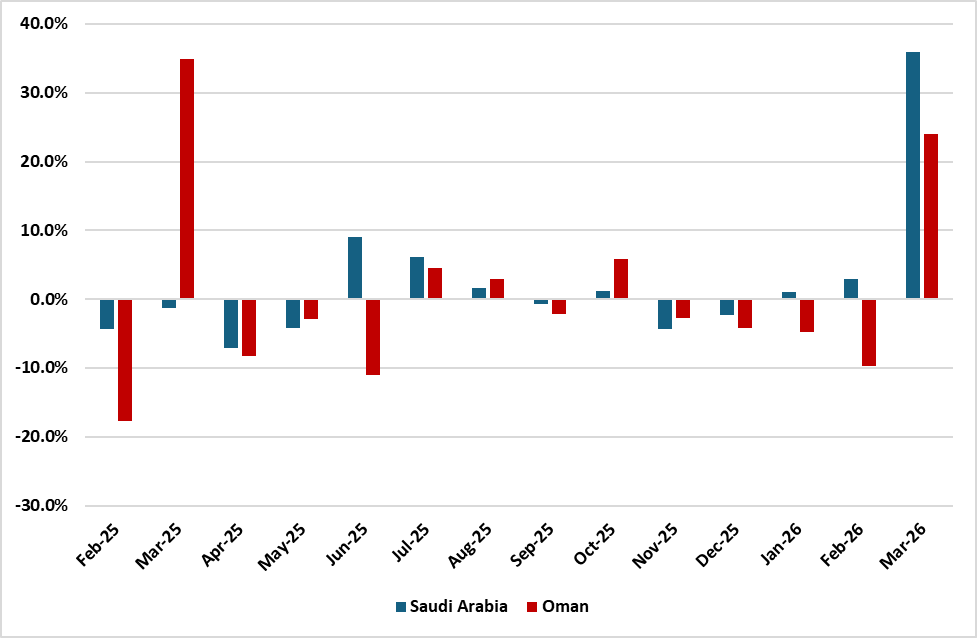
Figure 2. MoM Oil Revenue Growth in Saudi Arabia and Oman
Sources: GASTAT (Saudi Arabia), NCSI (Oman), Continuum Economics
Saudi Arabia’s national oil exports rose from USD 18.1 billion in February to USD 24.7 billion in March, a 36% jump, based on data from the General Authority for Statistics (GASTAT). The country managed the shock rather than escaped it, cutting production in line with regional disruption while higher prices lifted the value of every barrel that moved, and ramping its East-West pipeline to Red Sea terminals at Yanbu from around 770,000 to 2.9 million barrels per day, based on Kpler vessel-tracking data reported by Reuters. The score positions Saudi Arabia among the more diversified Gulf exporters, with mid-range exposure and solid buffering, while the data shows that flexibility expressed in real conditions through a combination of adjustment, infrastructure use, and price capture.
Oman illustrates a different register of the same logic. Oil (crude and refined) receipts rose 24% from February (USD 2.21 billion) to March (USD 2.74 billion), according to data from the National Centre for Statistics and Information (NCSI). The score positions Oman with high exposure and strong resilience, while the data shows the country posting a clean revenue gain, with its heavy dependence on oil becoming the channel through which higher prices flowed directly into improved national receipts.
Kuwait illustrates the sharpest case. As the most oil-dependent economy in the wider sample, it felt the physical disruption directly, with crude exports falling from 339.6 million barrels in February to 155 million in March, a 54% decline, according to data from the Joint Organization Data Initiative (JODI). The score positions Kuwait with the lowest exposure score in the sample and among the strongest on resilience, while the data shows a heavy volume hit absorbed against sovereign reserves among the world’s deepest and minimal public debt. The shortfall is sizeable, yet it sits well within the country’s fiscal capacity to manage.
Across the cases above, the scores and the data form two complementary readings. The oil-shock vulnerability indicator describes the structural composition of each Gulf sovereign, namely how dependent each economy is on oil and how much capacity each holds to absorb a swing in the oil market. The 2026 shock then shows how each country is being affected in real conditions, with production managed, revenues defended or improved, and fiscal stability holding even where physical volumes fell. Read together, the scores and the data complete a picture.