Published: 2026-06-08T02:50:40.000Z
Chart USD/SGD Update: Consolidating test of 1.2900/30 resistance
1
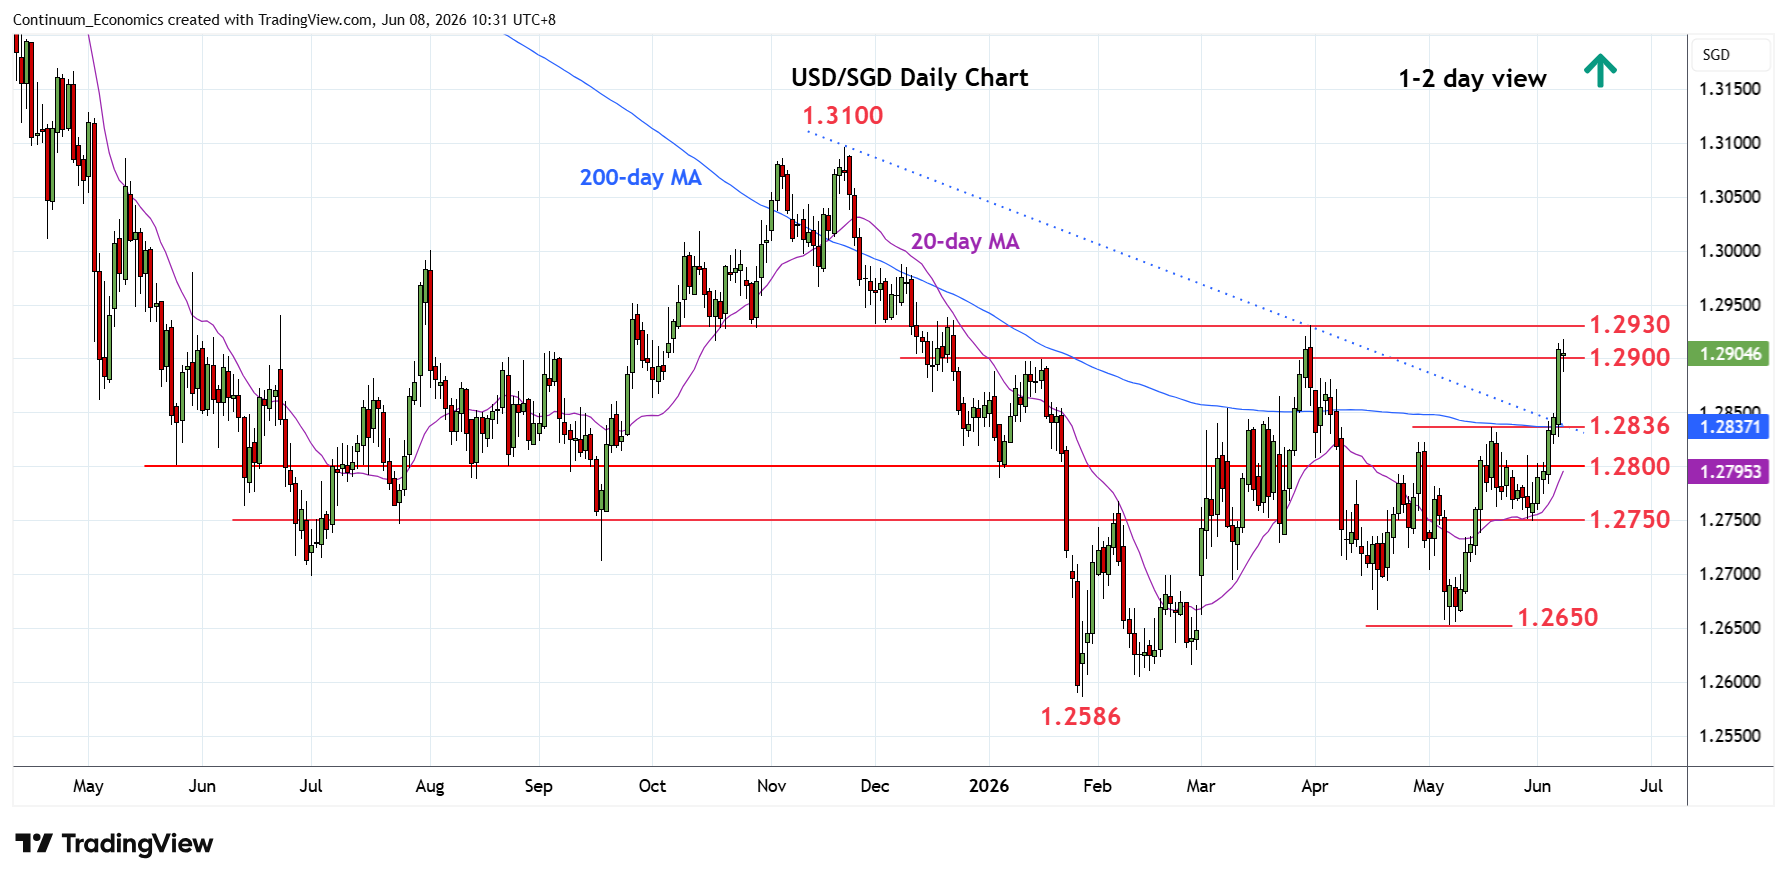
Break above the 1.2836 resistance and 200-day MA has seen gains to reach strong resistance at the 1.2900/30
| Level | Comment | Level | Comment | ||||
|---|---|---|---|---|---|---|---|
| R4 | 1.3050 | congestion | S1 | 1.2850 | * | congestion | |
| R3 | 1.3000 | ** | figure, congestion | S2 | 1.2836 | ** | May high |
| R2 | 1.2950 | * | congestion | S3 | 1.2800 | * | congestion |
| R1 | 1.2930 | ** | 31 Mar YTD high | S4 | 1.2750 | ** | 29 May low |
Asterisk denotes strength of level
02:35 GMT - Break above the 1.2836 resistance and 200-day MA has seen gains to reach strong resistance at the 1.2900/30 congestion and 31 March current year high. Consolidation here is expected to give way to renewed buying interest later to retest the 1.2930 high. Break here will extend the broader gains from the 28 January current year low at 1.2586 to further retrace losses from the 1.3100, November 2025 high. Higher will see scope to 1.2950 congestion and 1.3000 figure. Meanwhile, support is raised to the 1.2850/36 congestion and May high.