Chart USD/IDR Updates: Back in range
Sharp losses have bounced from the 17860 low of 30 September
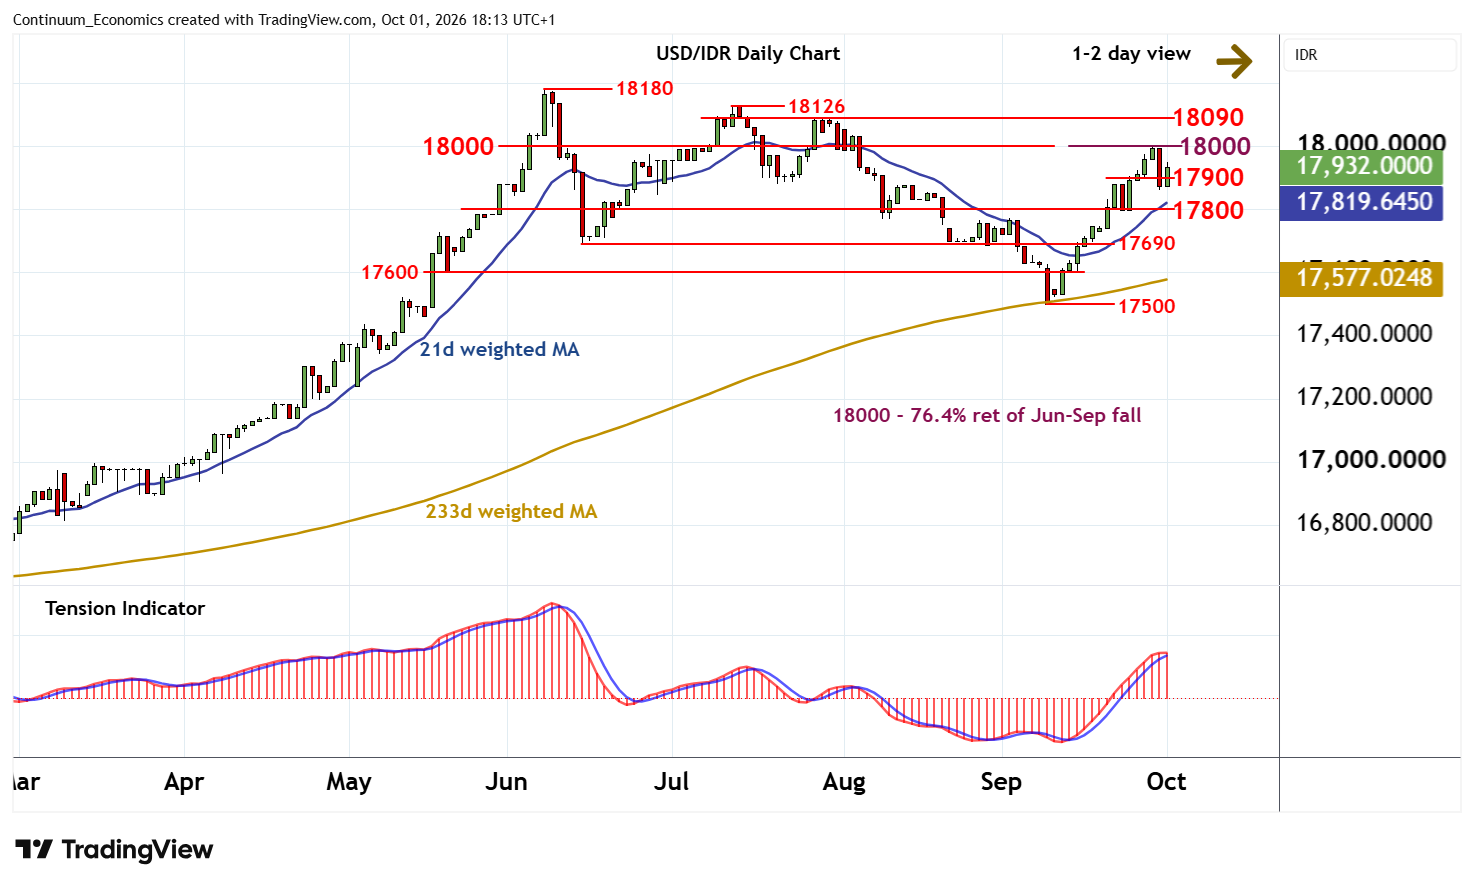
| Levels | Imp | Comment | Levels | Imp | Comment | |||
|---|---|---|---|---|---|---|---|---|
| R4 | 18180 | ** | 8 Jun YTD high | S1 | 17900 | * | pivot | |
| R3 | 18126 | ** | 13 Jul (m) high | S2 | 17800 | * | congestion | |
| R2 | 18090 | * | 28 Jul high | S3 | 17690 | ** | Jun low | |
| R1 | 18000 | ** | cong; 76.4% ret | S4 | 17600 | * | congestion |
Asterisk denotes strength of level
17:50 BST - Sharp losses have bounced from the 17860 low of 30 September, with prices once again trading above 17900. Focus is back on strong resistance at 18000. But unwinding overbought daily stochastics and the deteriorating daily Tension Indicator should limit any tests in renewed selling interest, before improving weekly charts prompt a break. A later close above here will open up the 18090 - 18126 highs from July. But already overbought daily stochastics should limit any initial tests in consolidation.
Meanwhile, a break back below 17900 will add weight to sentiment and open up congestion around 17800, where renewed buying interest is expected to appear.