Published: 2026-06-19T04:46:21.000Z
Chart USD/INR Update: Under pressure, room for further losses
1
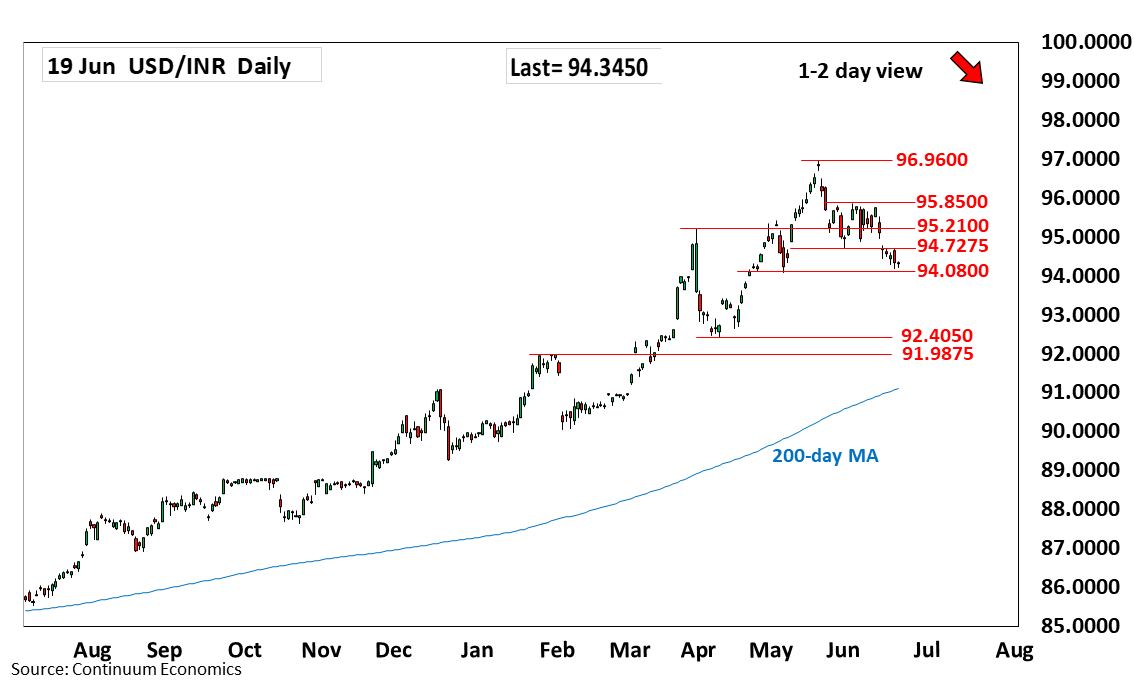
Pressure remains on the downside to extend losses from the 95.8500 high to reach 94.1800 low
| Level | Comment | Level | Comment | |||||
|---|---|---|---|---|---|---|---|---|
| R4 | 96.9600 | ** | 20 May all-time high | S1 | 94.1800 | * | 18 Jun low | |
| R3 | 96.0000 | * | figure | S2 | 94.0800 | ** | May low | |
| R2 | 95.8500 | ** | 3 Jun high | S3 | 93.4100 | ** | 15 Apr high | |
| R1 | 95.2100 | * | Mar high | S4 | 93.0000 | * | figure, congestion |
Asterisk denotes strength of level
04:45 GMT - Pressure remains on the downside to extend losses from the 95.8500 high to reach 94.1800 low. Nearby see strong support at the 94.0800/94.0000 area where reaction is expected though the downside remains vulnerable and see risk for break later. Below the latter will open up room for deeper pullback to support at 93.4100 then the 93.0000 figure. Meanwhile, resistance at the 95.2100 March high is expected to cap corrective bounce. Break, if seen, will open up room for stronger bounce to retest of resistance at 95.8500.