Published: 2026-07-29T05:39:29.000Z
Chart USD/TWD Update: Extending gains
3
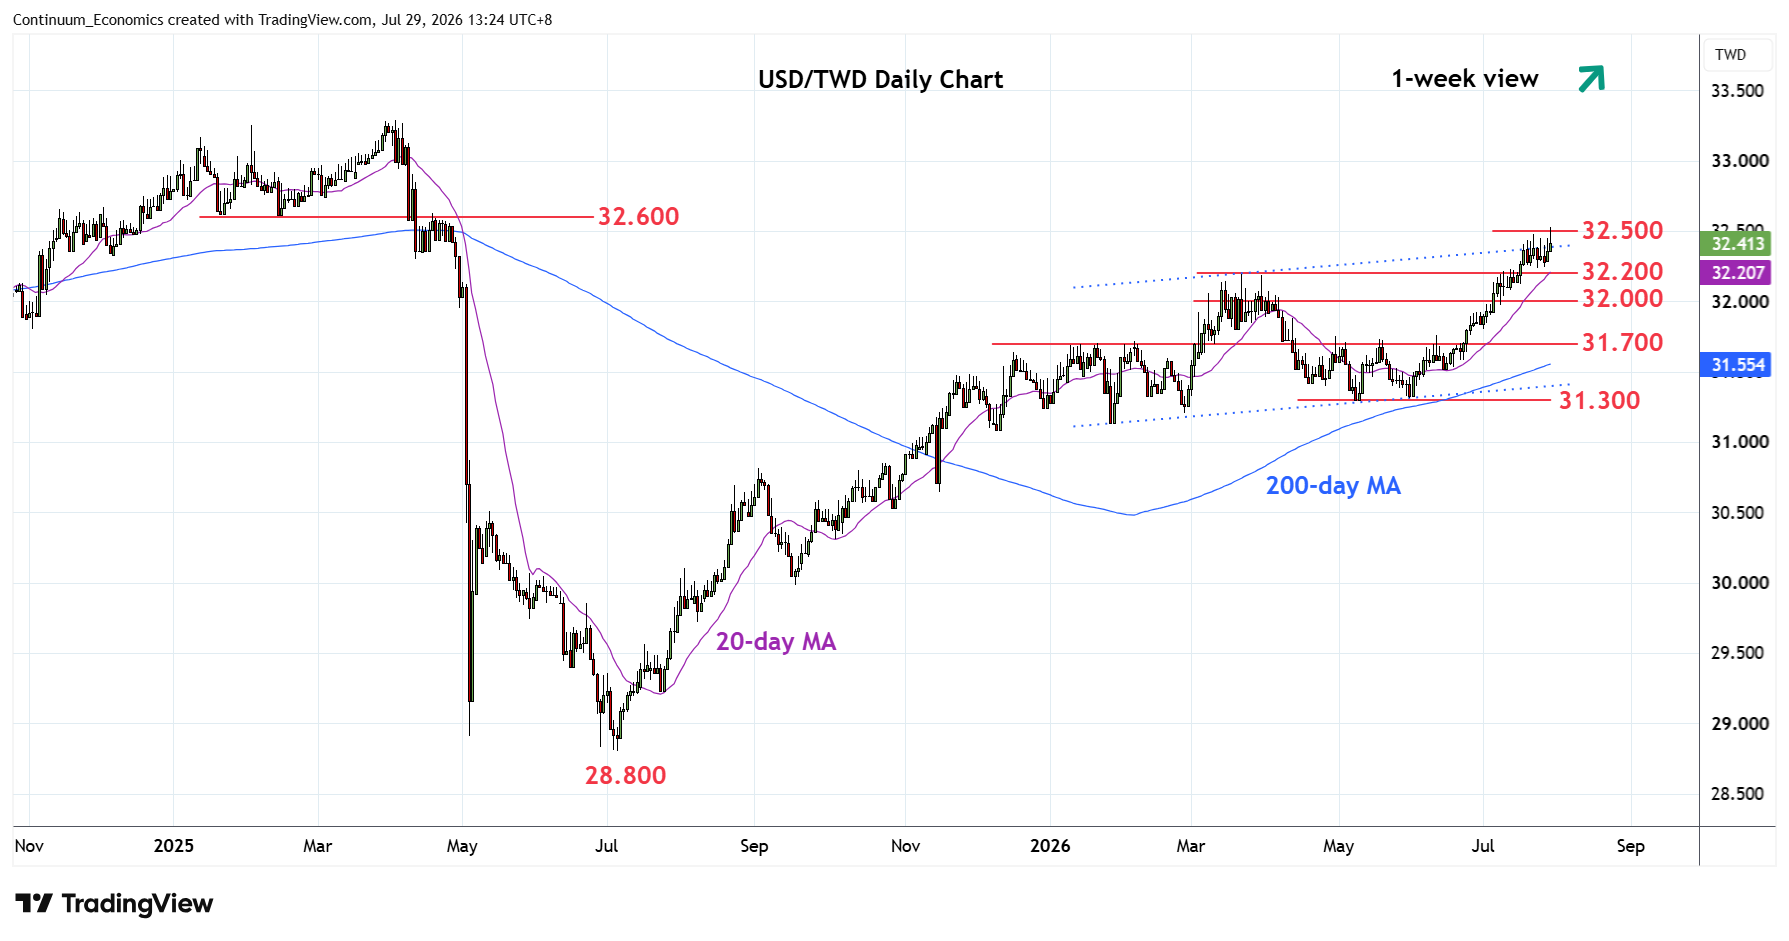
Extending gains and break above 32.400 has seen gains to reach the 32.500 congestion and 2023 year high
| Levels | Imp | Comment | Levels | Imp | Comment | |||
|---|---|---|---|---|---|---|---|---|
| R4 | 32.900 | ** | 2024 year high | S1 | 32.200 | * | Mar high | |
| R3 | 32.700 | * | Apr 2024 high | S2 | 32.000 | * | congestion | |
| R2 | 32.600 | * | congestion | S3 | 31.800 | * | congestion | |
| R1 | 32.500 | * | congestion, 2023 yr high | S4 | 31.700 | ** | Jan, Feb highs |
05:40 GMT - Extending gains and break above 32.400 has seen gains to reach the 32.500 congestion and 2023 year high. Overbought daily and weekly studies suggest reaction here likely but a later break will extend bullish prices action from July 2025 year low. Clearance will see room for extension to 32.600/32.700 congestion and high of April 2024. Meanwhile, support is raised to 32.200 March high which should underpin. Would take break here to open up room for deeper pullback to retrace strong gains from the 31.300, May/June lows.