Published: 2026-10-30T02:51:20.000Z
Chart USD/SGD Update: Extend pullback from 1.2837 high
1
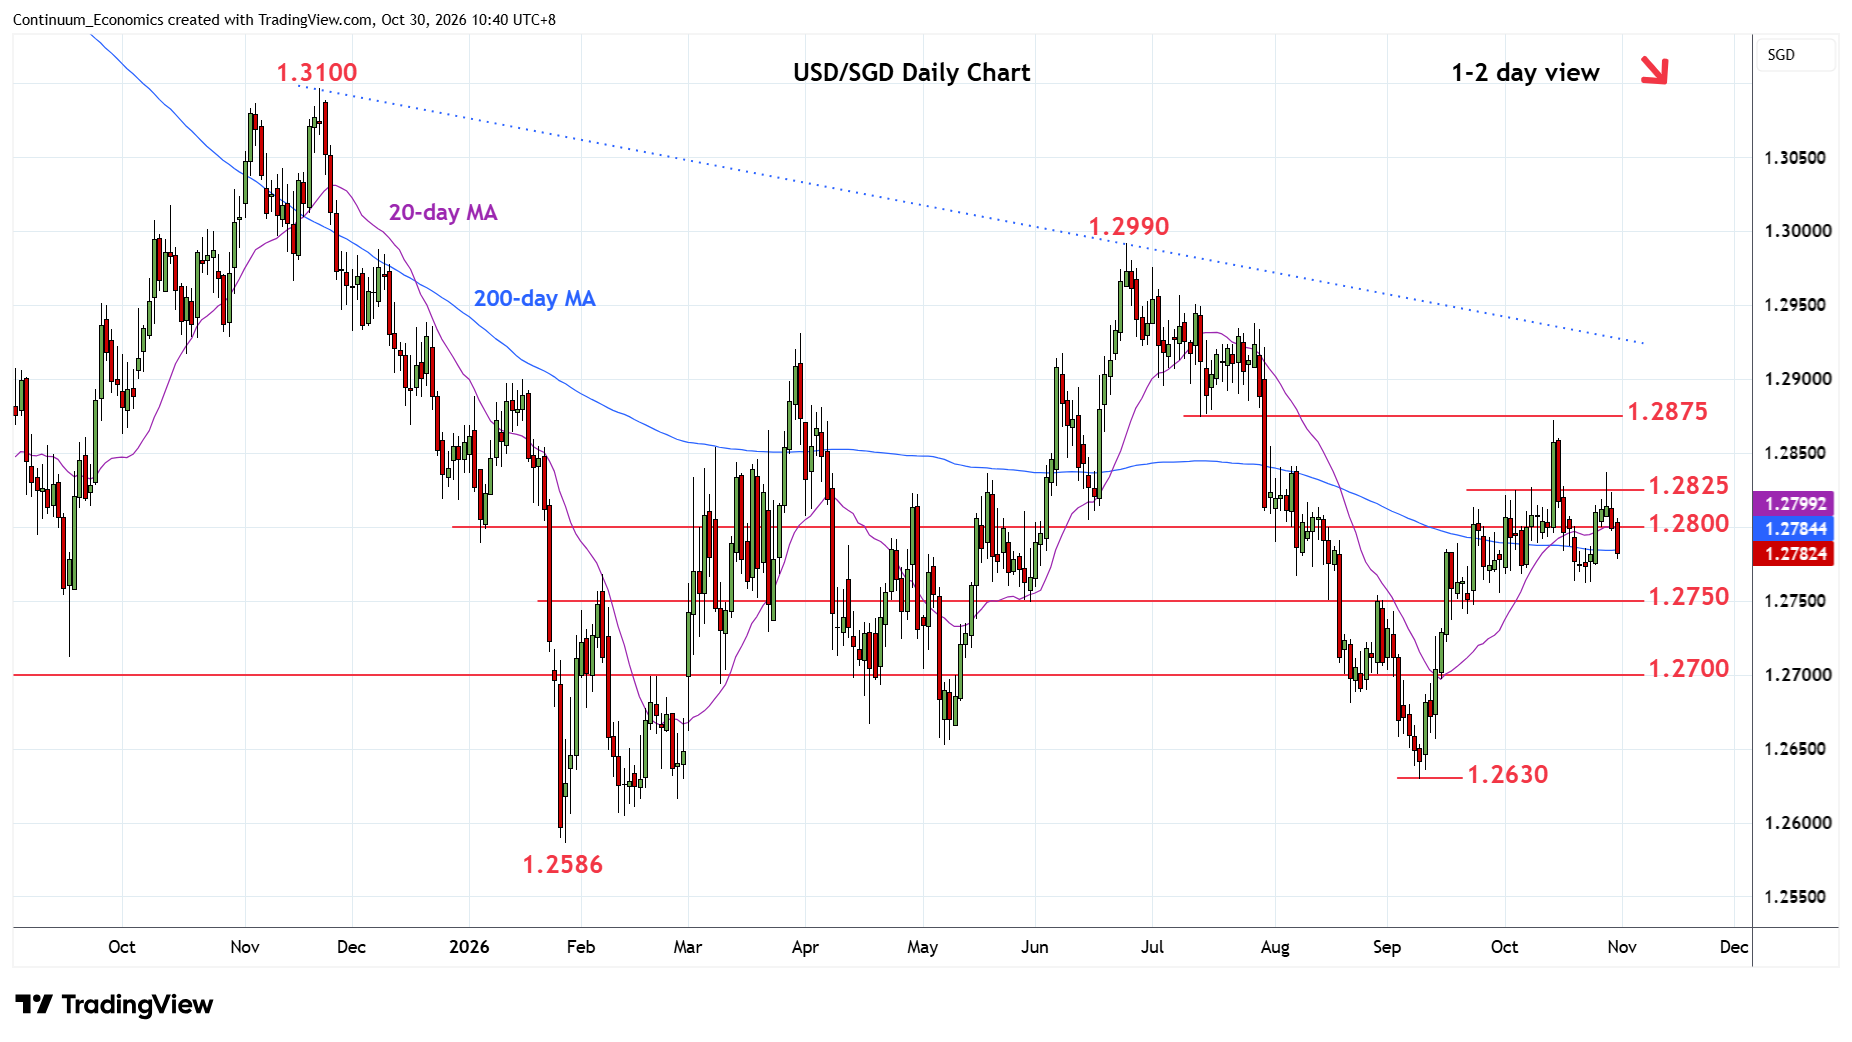
Extending rejection from the 1.2837 mid-week high through the 1.2800 level as prices unwind overbought daily and weekly studies
| Level | Comment | Level | Comment | ||||
|---|---|---|---|---|---|---|---|
| R4 | 1.2900 | * | congestion | S1 | 1.2762/50 | ** | 22 Oct low, congestion |
| R3 | 1.2875 | ** | 14 Jul low | S2 | 1.2700 | * | congestion, 2025 yr low |
| R2 | 1.2850 | * | congestion | S3 | 1.2680 | * | Aug low |
| R1 | 1.2800/25 | * | congestion | S4 | 1.2650 | * | congestion |
Asterisk denotes strength of level
02:45 GMT - Extending rejection from the 1.2837 mid-week high through the 1.2800 level as prices unwind overbought daily and weekly studies. Focus now return to the 1.2762/50 support and neckline of a potential top pattern at the 1.2872, 14 October high. Break will open up room for deeper pullback to retrace strong gains from the 1.2630 Spetember low and see room to the 1.2700/1.2680 congestion and August low. Meanwhile, resistance at the 1.2800/25 congestion now expected to cap and sustain losses from the 1.2837 pin bar high.