Published: 2026-06-16T02:09:16.000Z
Chart USD/SGD Update: Room to extend losses
1
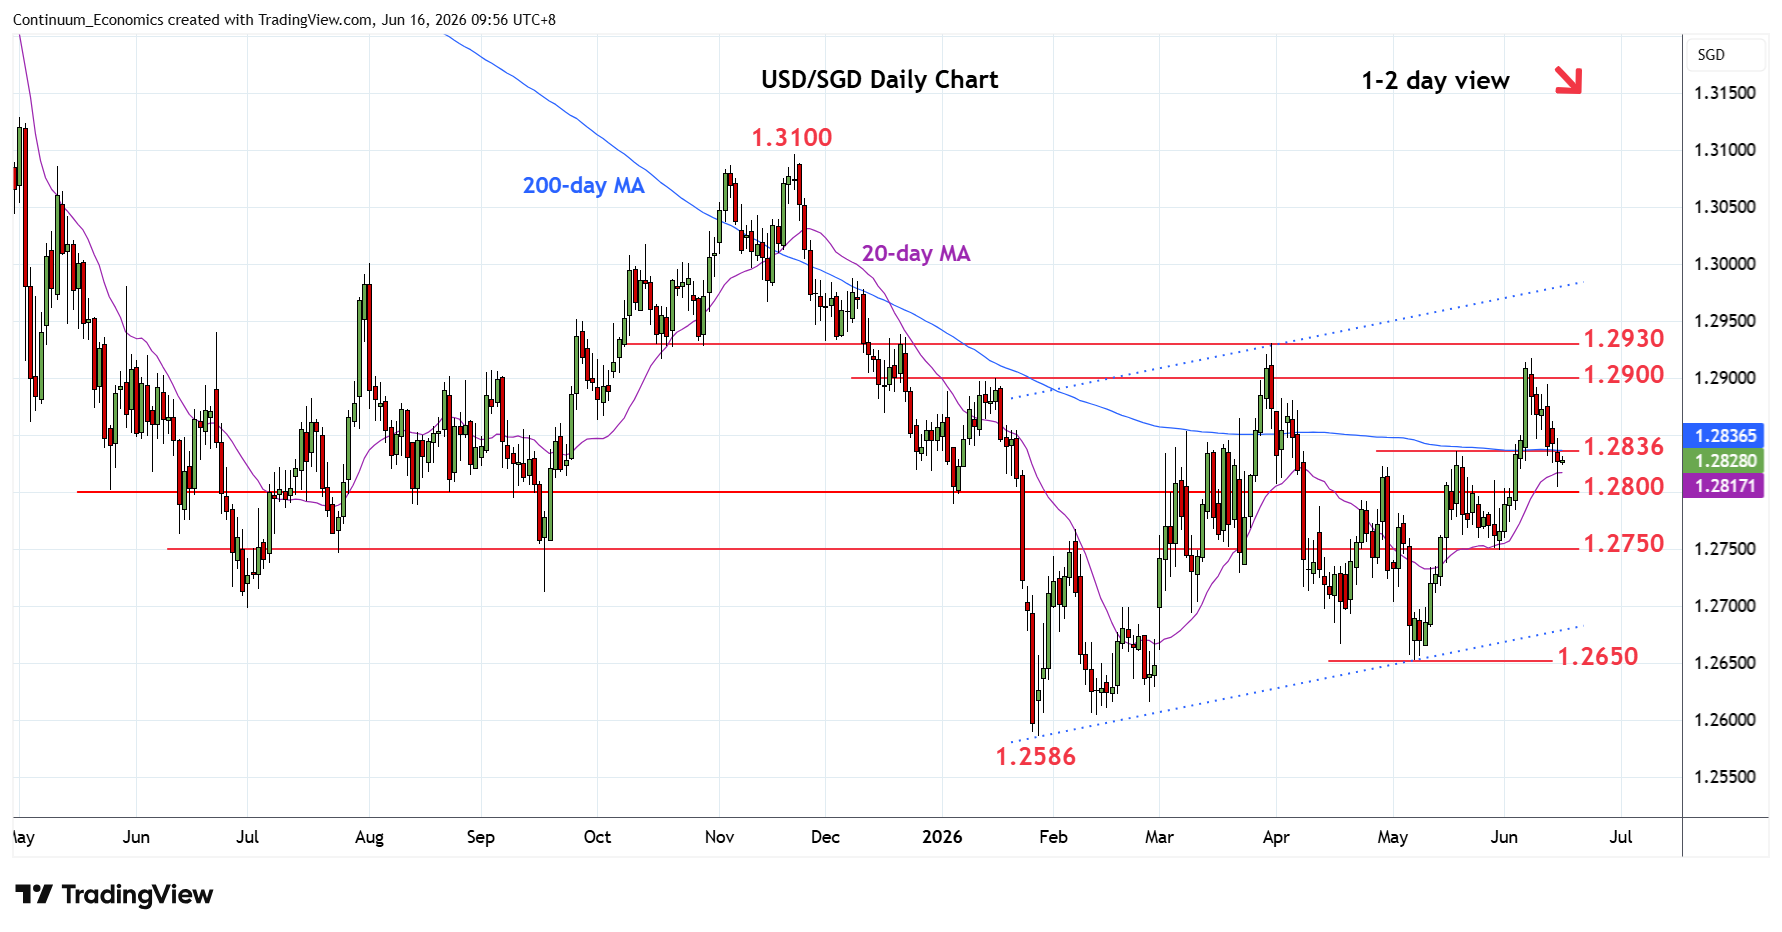
Break below support at 1.2836 May high has seen deeper pullback towards support at the 1.2800 congestion
| Level | Comment | Level | Comment | ||||
|---|---|---|---|---|---|---|---|
| R4 | 1.2930 | ** | 31 Mar YTD high | S1 | 1.2800 | * | congestion |
| R3 | 1.2918 | ** | 8 Jun high | S2 | 1.2750 | ** | 29 May low |
| R2 | 1.2900 | * | congestion | S3 | 1.2700 | ** | 2025 yr low, congestion |
| R1 | 1.2850 | * | congestion | S4 | 1.2650 | ** | May low |
Asterisk denotes strength of level
02:05 GMT - Break below support at 1.2836 May high has seen deeper pullback towards support at the 1.2800 congestion. Daily studies are tracking lower from overbought areas and suggest scope for break here to extend losses from the 1.2918 high of last week towards strong support at 1.2750/1.2700, the 29 May and 2025 year lows. Meanwhile, resistance is lowered to 1.2836/50 May high and congestion area which is expected to cap and sustain losses from the 1.2918 high.