Published: 2026-05-20T02:41:20.000Z
Chart USD/SGD Update: Pressuring 1.2823/40 resistance
1
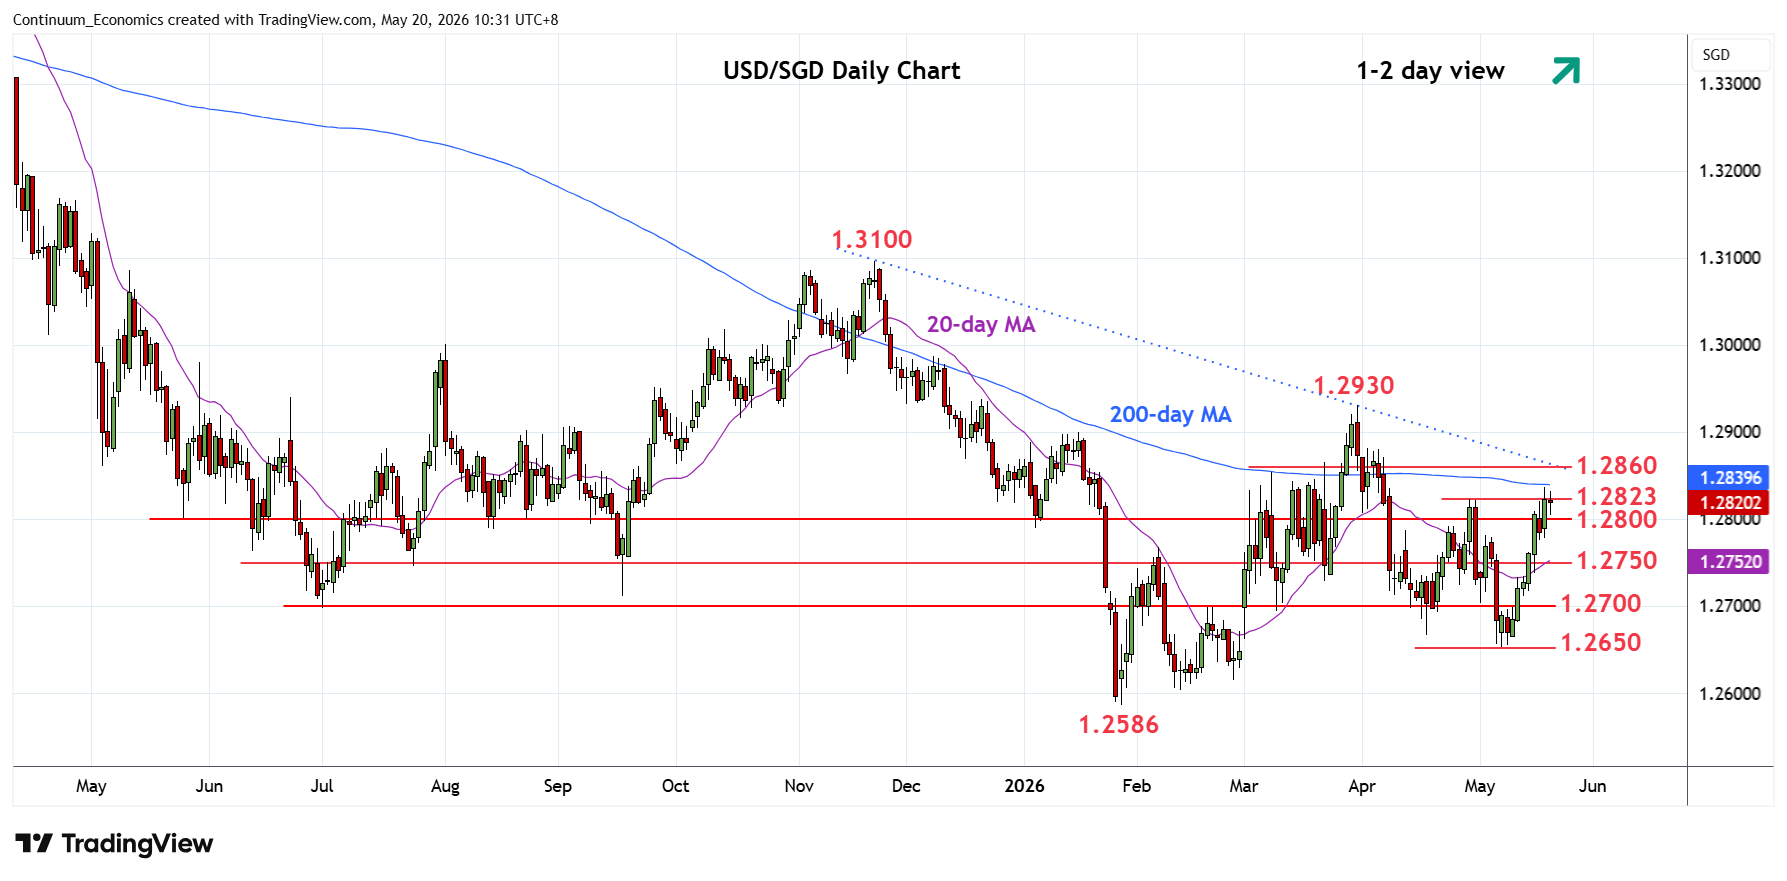
Pressure remains on the upside to reach the 1.2823/40 high of 29 April and 200-day MA
| Level | Comment | Level | Comment | ||||
|---|---|---|---|---|---|---|---|
| R4 | 1.2900 | * | congestion | S1 | 1.2800 | * | congestion |
| R3 | 1.2860 | ** | Nov trendline | S2 | 1.2750/35 | ** | congestion, 13 May high |
| R2 | 1.2840 | * | 200-day MA | S3 | 1.2700 | * | congestion |
| R1 | 1.2823 | * | 29 Apr high | S4 | 1.2650 | ** | 7 May low |
Asterisk denotes strength of level
02:35 GMT - Pressure remains on the upside to reach the 1.2823/40 high of 29 April and 200-day MA. Higher still, will see room for further gains to resistance at the 1.2860 November trendline which is expected to cap. Break here, if seen, will return focus to the 1.2930 March current year highg. Meanwhile, support is raised to 1.2800 level which should underpin. Below this will ease the upside pressure and open up room for pullback to strong support at the 1.2735/50 congestion area.