Published: 2026-05-19T02:09:21.000Z
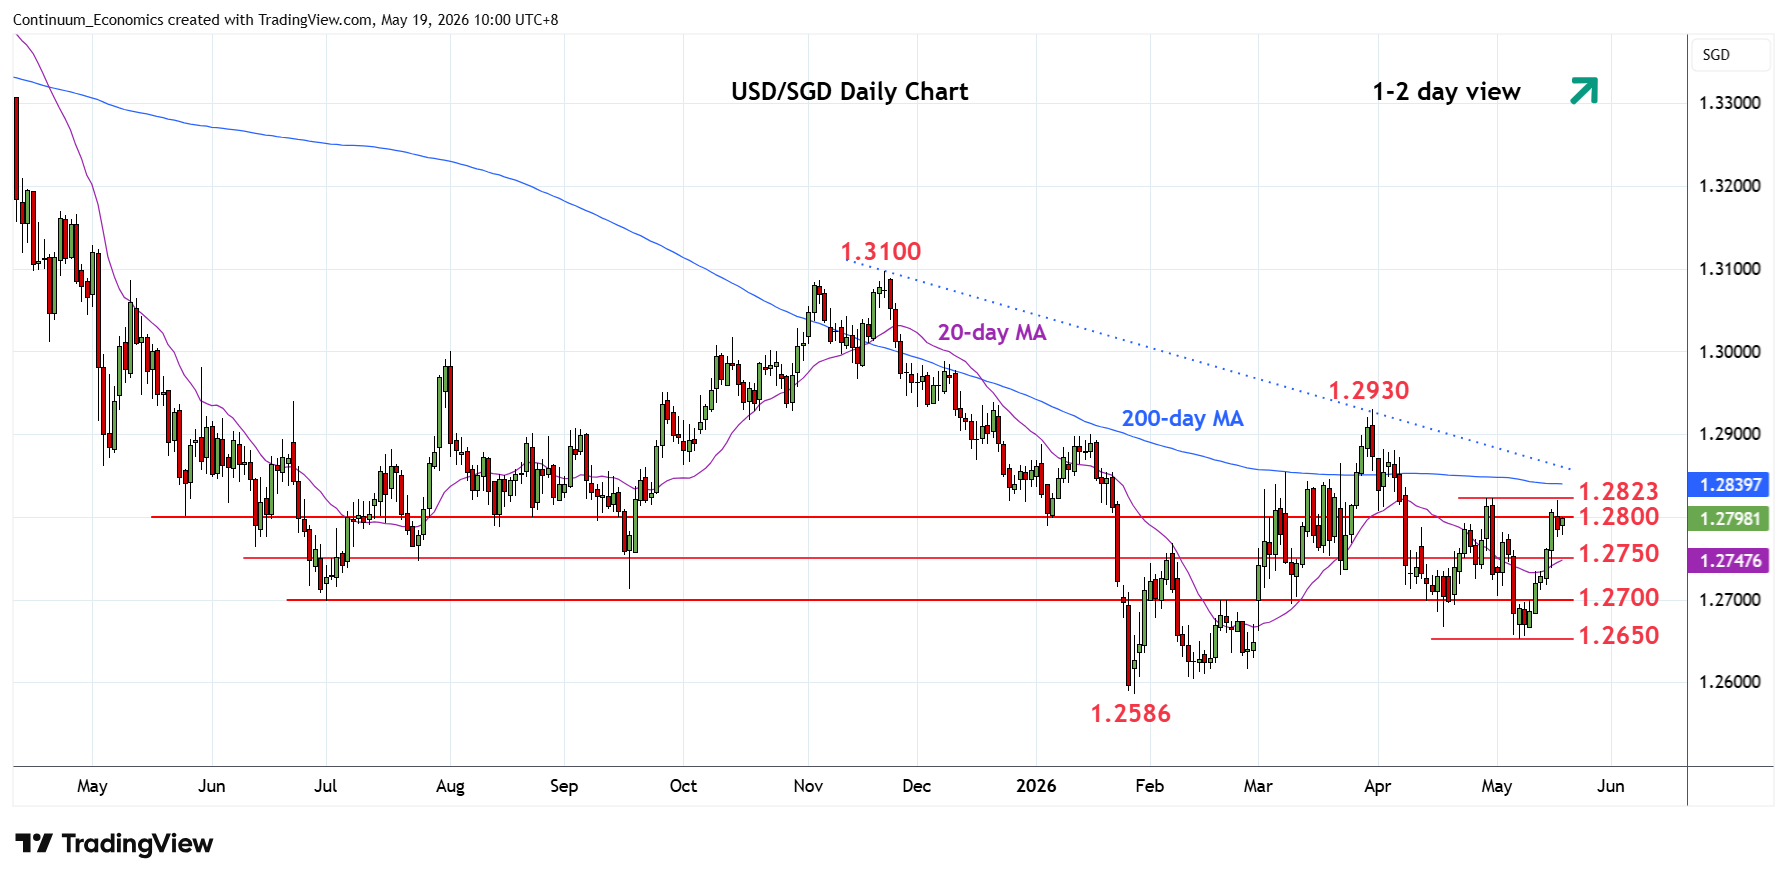
Chart USD/SGD Update: Consolidating test of 1.2823 resistance
1
Settled back from test of the 1.2823 high of 29 April as prices consolidate gains from the 1.2650, 7 May swing low
| Level | Comment | Level | Comment | ||||
|---|---|---|---|---|---|---|---|
| R4 | 1.2900 | * | congestion | S1 | 1.2750 | * | congestion |
| R3 | 1.2860 | ** | Nov trendline | S2 | 1.2700 | * | congestion |
| R2 | 1.2840 | * | 200-day MA | S3 | 1.2667 | * | Apr low |
| R1 | 1.2823 | ** | 29 Apr high | S4 | 1.2650 | ** | 7 May low |
Asterisk denotes strength of level
02:05 GMT - Settled back from test of the 1.2823 high of 29 April as prices consolidate gains from the 1.2650, 7 May swing low. Further gains cannot be ruled out and higher will see room to resistance at the 1.2840/60, 200-day MA and November trendline. This area is expected to cap and given way to renewed selling pressure later. Meanwhile, support is raised to 1.2750 which should underpin. Below this will ease the upside pressure and open up room for pullback to retest the 1.2700 level then 1.2667/50, April and 7 May lows.