Published: 2026-09-21T06:32:36.000Z
Chart USD/IDR Updates: Extending gains
2
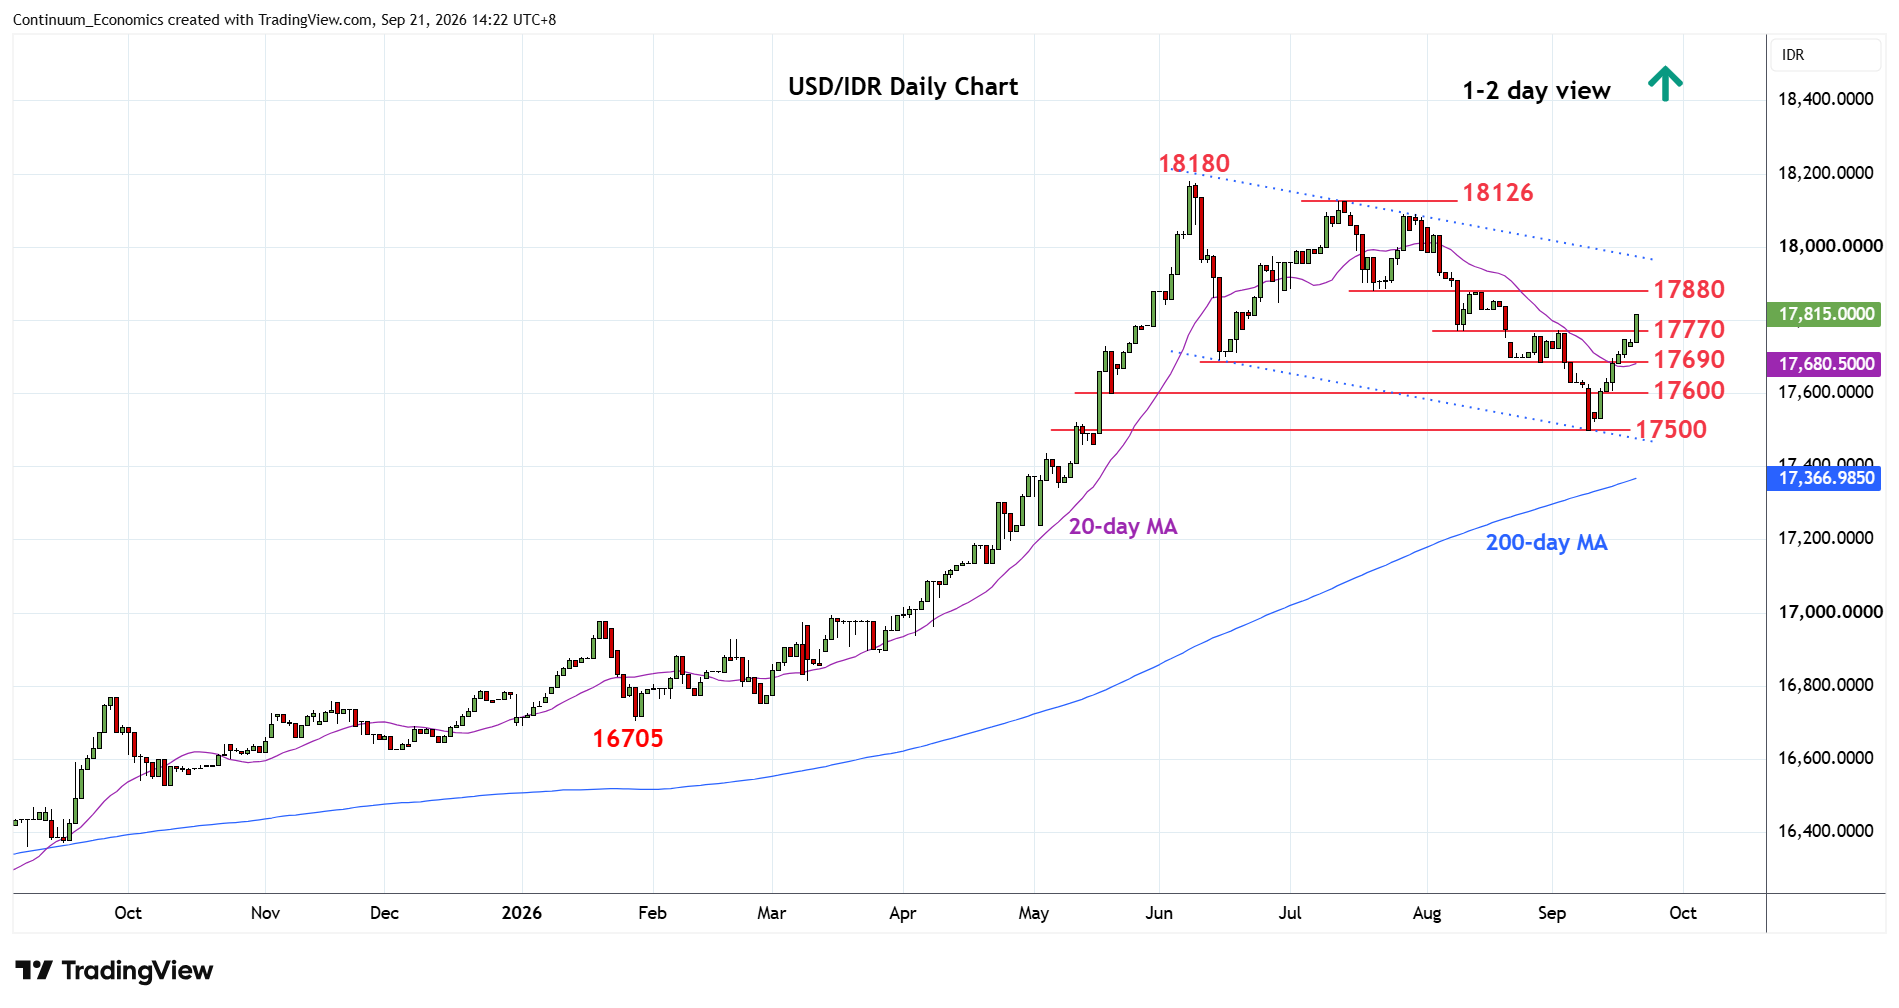
Consolidation beneath resistance at the 17770/17800 area last week has given way to break to extend gains from 17500 low of 9 September
| Levels | Imp | Comment | Levels | Imp | Comment | |||
|---|---|---|---|---|---|---|---|---|
| R4 | 18126 | ** | 13 Jul high | S1 | 17690 | ** | Jun low | |
| R3 | 18090 | * | 28 Jul high | S2 | 17600 | * | congestion | |
| R2 | 18000 | * | figure | S3 | 17500 | ** | 9 Sep low | |
| R1 | 17880/900 | ** | Jul low, congestion | S4 | 17450 | * | congestion |
Asterisk denotes strength of level
06:30 GMT - Consolidation beneath resistance at the 17770/17800 area last week has given way to break to extend gains from 17500 low of 9 September. Focus now turn to strong resistance at the 17880/17900, July low and congestion area where reaction can be expected. Break here, if seen, will see continuation to channel resistance at 17980 and 18000 level. Meanwhile, support is raised to the 17770/17750 area and extending to 17690, August low. Break of the latter needed to fade the upside pressure and see return to the 17600 congestion then the 17500 low.