Published: 2026-08-20T04:58:23.000Z
Chart USD/MYR Update: Extending losses
2
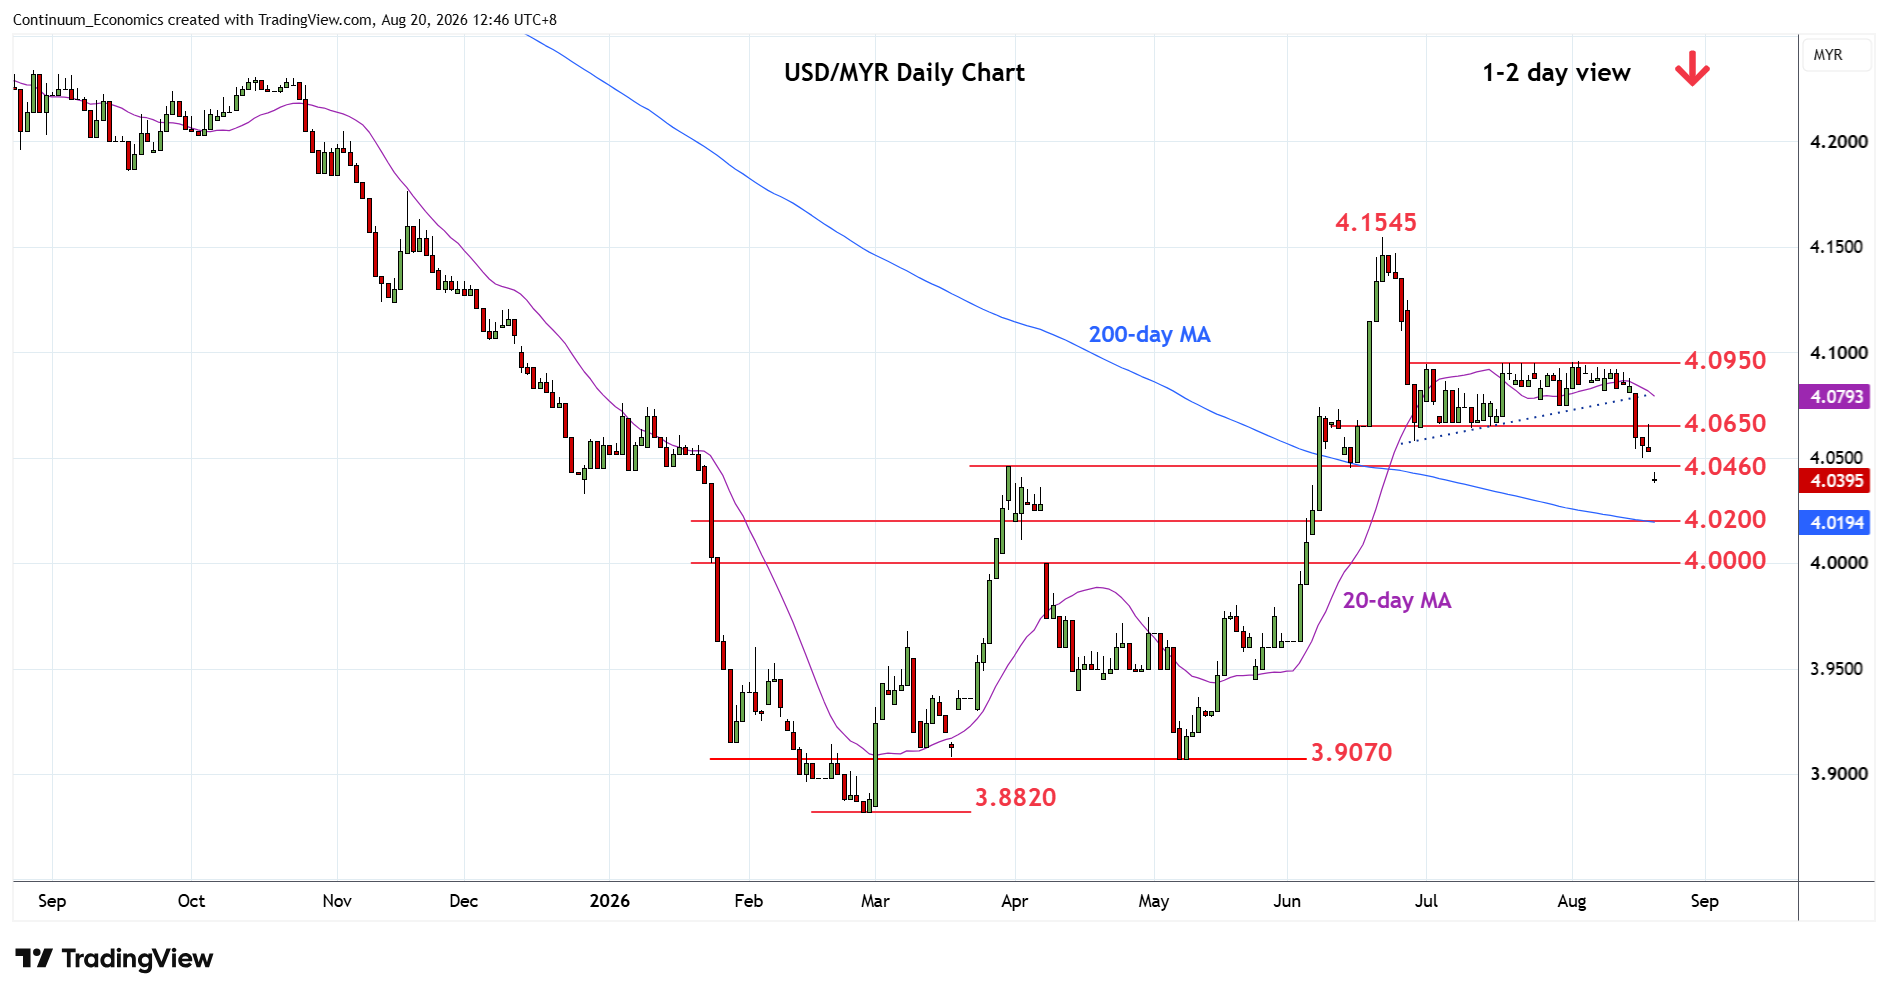
Break of support at the 4.0650/4.0600 area has seen follow-through below strong support at 4.0460
| Levels | Imp | Comment | Levels | Imp | Comment | |||
|---|---|---|---|---|---|---|---|---|
| R4 | 4.0800 | congestion | S1 | 4.0300 | * | 50% May/Jun rally | ||
| R3 | 4.0750 | * | 30 Jul low | S2 | 4.0200 | * | congestion | |
| R2 | 4.0650 | ** | congestion | S3 | 4.0000 | ** | figure, 61.8% | |
| R1 | 4.0460/500 | * | Mar high, congestion | S4 | 3.9800 | ** | May high |
Asterisk denotes strength of level
04:50 GMT - Break of support at the 4.0650/4.0600 area has seen follow-through below strong support at 4.0460. Negative daily and weekly studies keep pressure on the downside and suggest room for deeper pullback to the 4.0300/4.0200, 50% Fibonacci level and congestion area. Lower still, will see room to the 4.0000 figure and 61.8% Fibonacci level. Meanwhile, resistance is lowered to 4.0460/4.0500 area which is expected to cap. Above here will ease the downside pressure and see stronger bounce to the 4.0650/4.0750, recent July lows.