Published: 2026-06-02T02:36:26.000Z
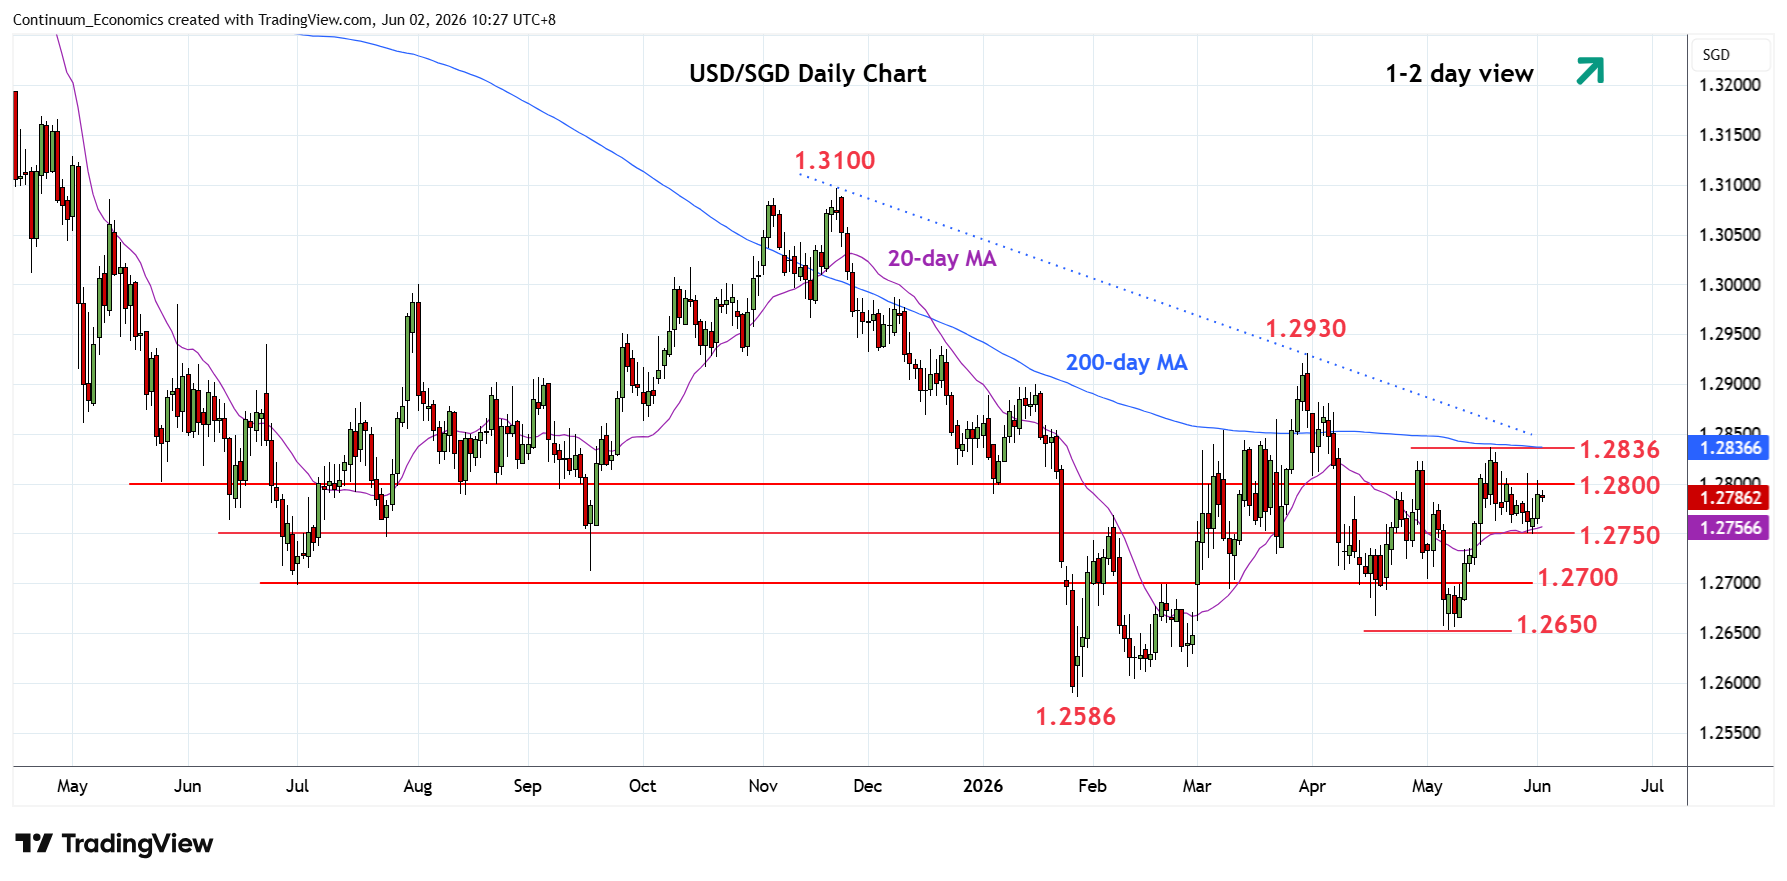
Chart USD/SGD Update: Higher in consolidation from 1.2750 support
1
Higher in range following bounce from the 1.2750 low last week as prices consolidate losses from the 1.2836 May high
| Level | Comment | Level | Comment | ||||
|---|---|---|---|---|---|---|---|
| R4 | 1.2900 | * | congestion | S1 | 1.2750 | ** | 29 May low |
| R3 | 1.2850 | * | congestion | S2 | 1.2735 | * | 13 May high |
| R2 | 1.2836 | ** | 19 May high, 200-day MA | S3 | 1.2700 | ** | congestion |
| R1 | 1.2800 | * | congestion | S4 | 1.2650 | ** | 7 May low |
Asterisk denotes strength of level
02:30 GMT - Higher in range following bounce from the 1.2750 low last week as prices consolidate losses from the 1.2836 May high. Above the 1.2800 level will set up scope for retest of the 1.2836 high and 200-day MA. Higher still, will see room to 1.2850 congestion and trendline from the 1.3100 November high. Clearance here will return focus to the 1.2930 March YTD high. Meanwhile, support at the 1.2750 low should underpin. Would take break here to fade the upside pressure and see deeper pullback to retrace gains from the 1.2650 low of 7 May.