Published: 2026-10-13T02:58:00.000Z
Chart USD/MYR Update: Lower in consolidation
1
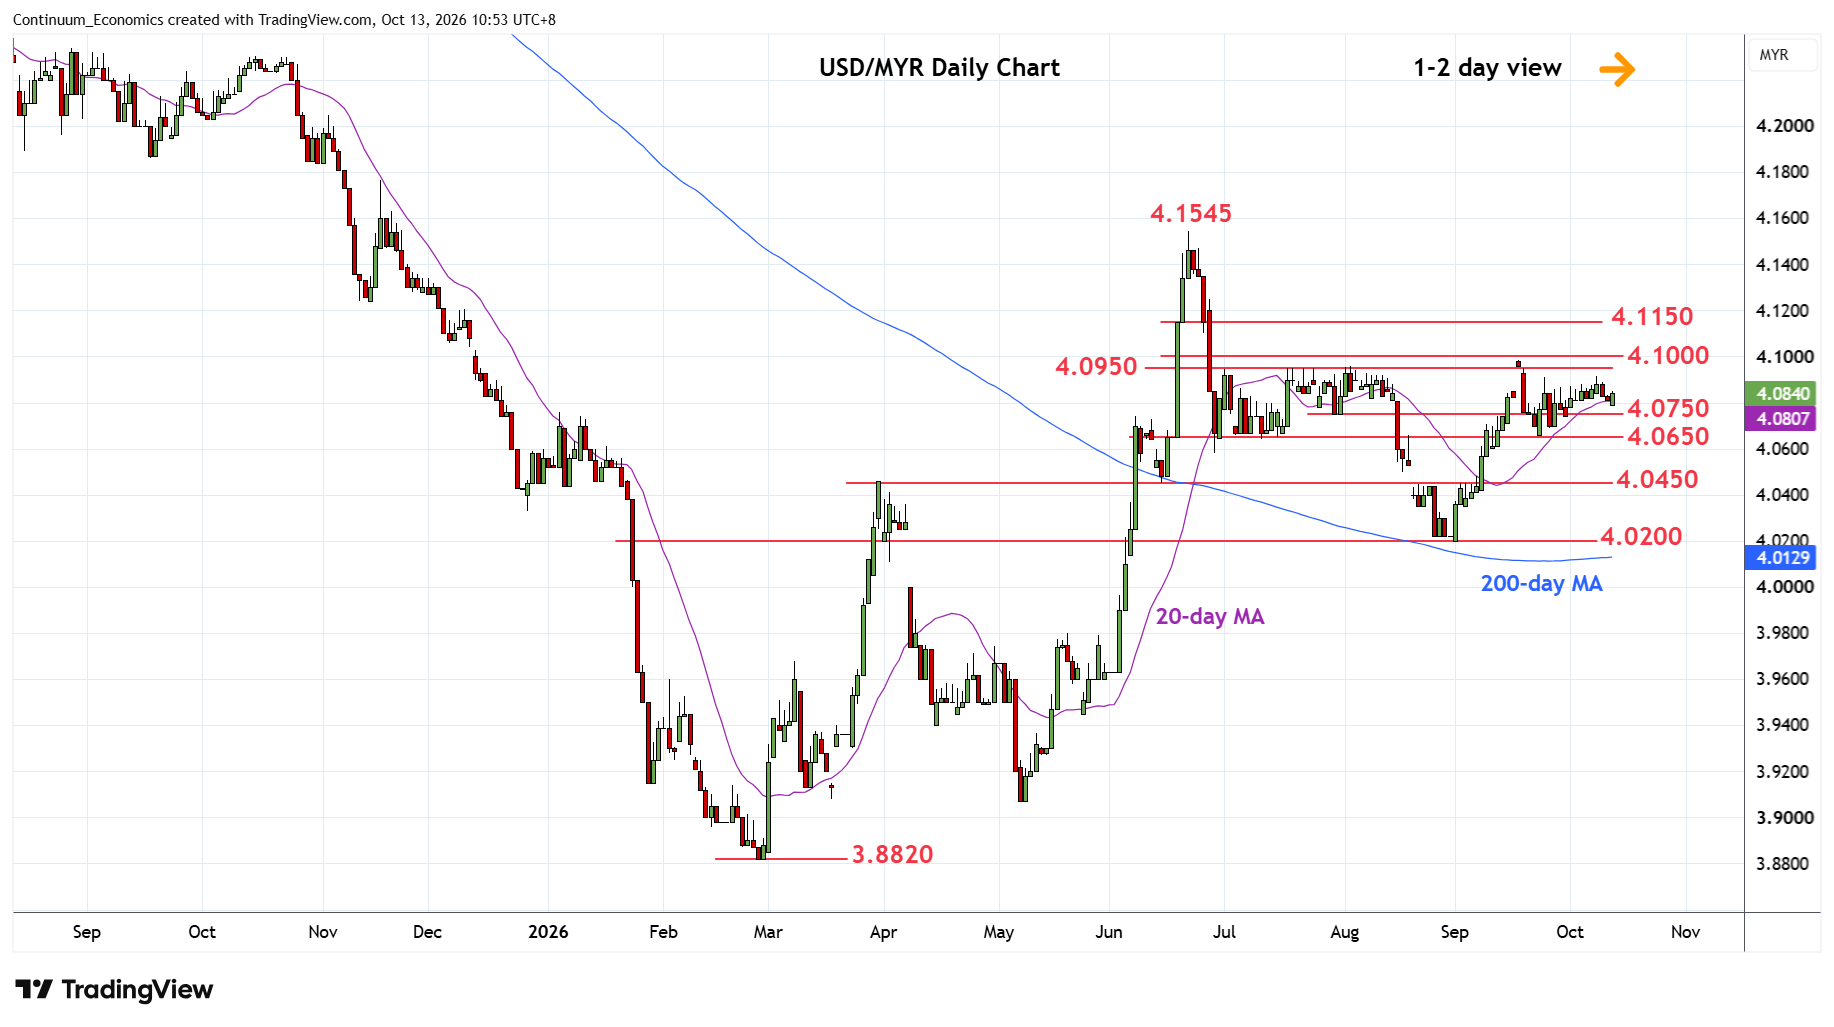
Edged lower from the 4.0915 high of last week as prices extend consolidation below strong resistance at the 4.0950/4.1000 area
| Levels | Imp | Comment | Levels | Imp | Comment | |||
|---|---|---|---|---|---|---|---|---|
| R4 | 4.1350 | * | congestion | S1 | 4.0750 | * | congestion | |
| R3 | 4.1250 | * | 26 Jun high | S2 | 4.0650 | ** | Jul low | |
| R2 | 4.1150 | * | congestion | S3 | 4.0600 | * | congestion | |
| R1 | 4.0950/00 | ** | Jul high, congestion | S4 | 4.0450 | ** | 2 Sep high |
Asterisk denotes strength of level
02:0 GMT - Edged lower from the 4.0915 high of last week as prices extend consolidation below strong resistance at the 4.0950/4.1000 area. Pullback see support at the 4.0750/4.0650 area which should underpin. However, daily studies are unwinding overbought readings and threatens break here to fade the upside pressure and open up room for deeper pullback to retrace the September gains. Break will see room for extension towards support at the 4.0450/4.0400 congestion area. Meanwhile, resistance at the 4.0950/4.1000 congestion area is expected to cap.