Chart USD/MXN Update: Sharp corrective bounce
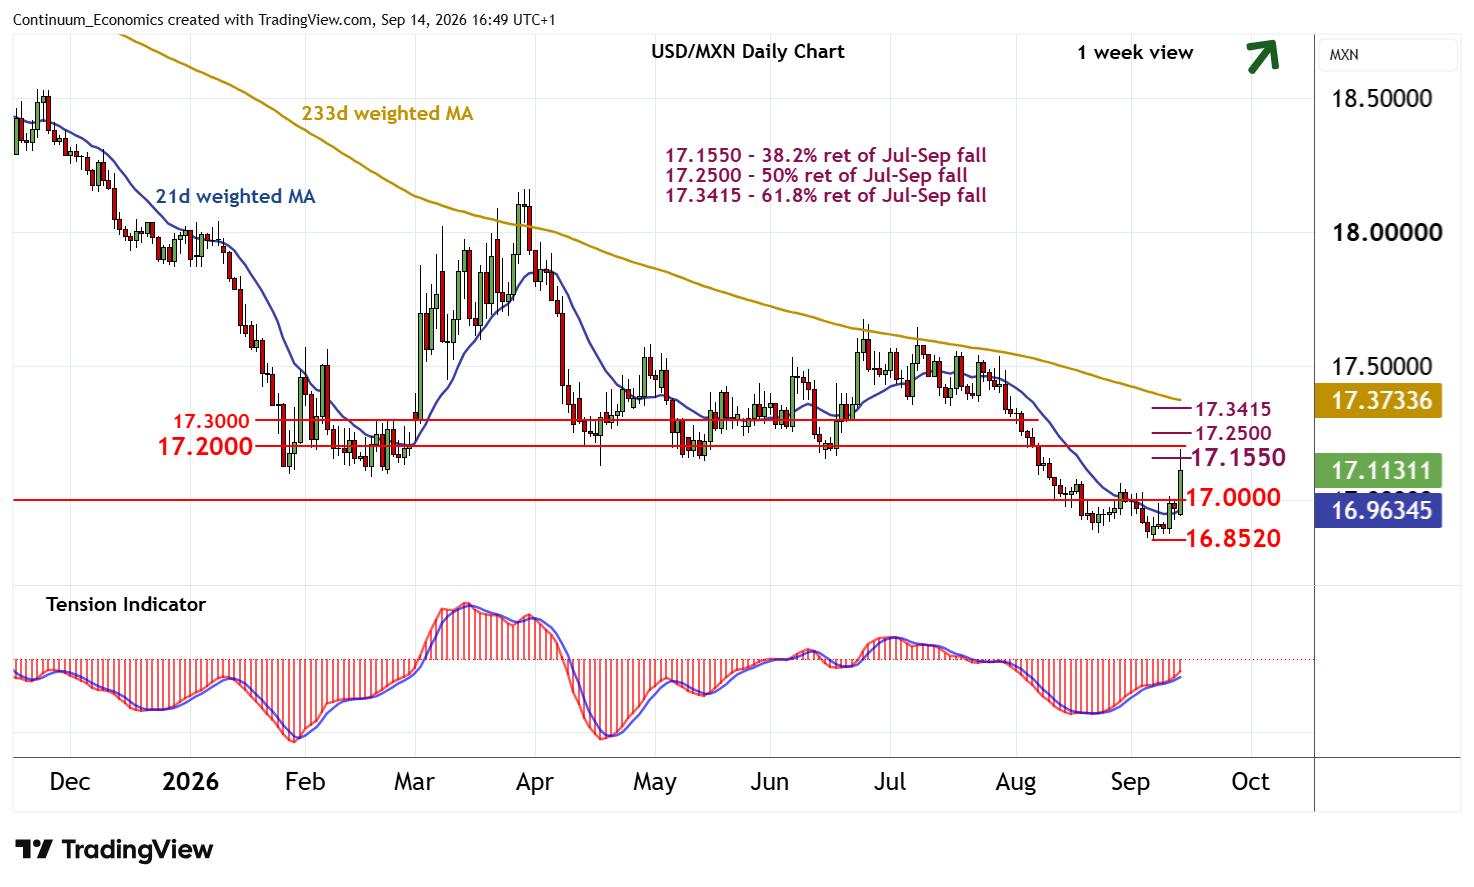
Consolidation above the 16.8520 current year low of 7 September has given way to a bounce in USD- and MXN-driven trade
| Levels | Imp | Comment | Levels | Imp | Comment | |||
|---|---|---|---|---|---|---|---|---|
| R4 | 17.3000 | * | break level | S1 | 17.0000 | ** | congestion | |
| R3 | 17.2500 | ** | 50% ret of Jul-Sep fall | S2 | 16.9000 | congestion | ||
| R2 | 17.2000 | * | break level | S3 | 16.8520 | ** | 7 Sep YTD low | |
| R1 | 17.1550 | * | 38.2% ret of Jul-Sep fall | S4 | 16.7000 | * | congestion |
Asterisk denotes strength of level
16:30 BST - Consolidation above the 16.8520 current year low of 7 September has given way to a bounce in USD- and MXN-driven trade. The break above 17.0000 has improved price action and reached resistance at the 17.1550 Fibonacci retracement, where minor reactions are appearing. Daily stochastics and the daily Tension Indicator are improving, and broader weekly charts are turning mixed/positive, suggesting an improvement in sentiment and room for further strength in the coming week. A break above 17.1550 will open up 17.2000. But daily stochastics are already overbought, suggesting any further strength could meet profit-taking towards the 17.2500 retracement.
Meanwhile, a close back below 17.0000 will turn sentiment cautious and prompt consolidation above 16.8520. A close beneath here, not seen, will turn sentiment bearish and extend February 2025 losses towards congestion around 16.7000.