Published: 2026-06-23T04:33:58.000Z
Chart USD/IDR Updates: Extend consolidation above 17690 low
-
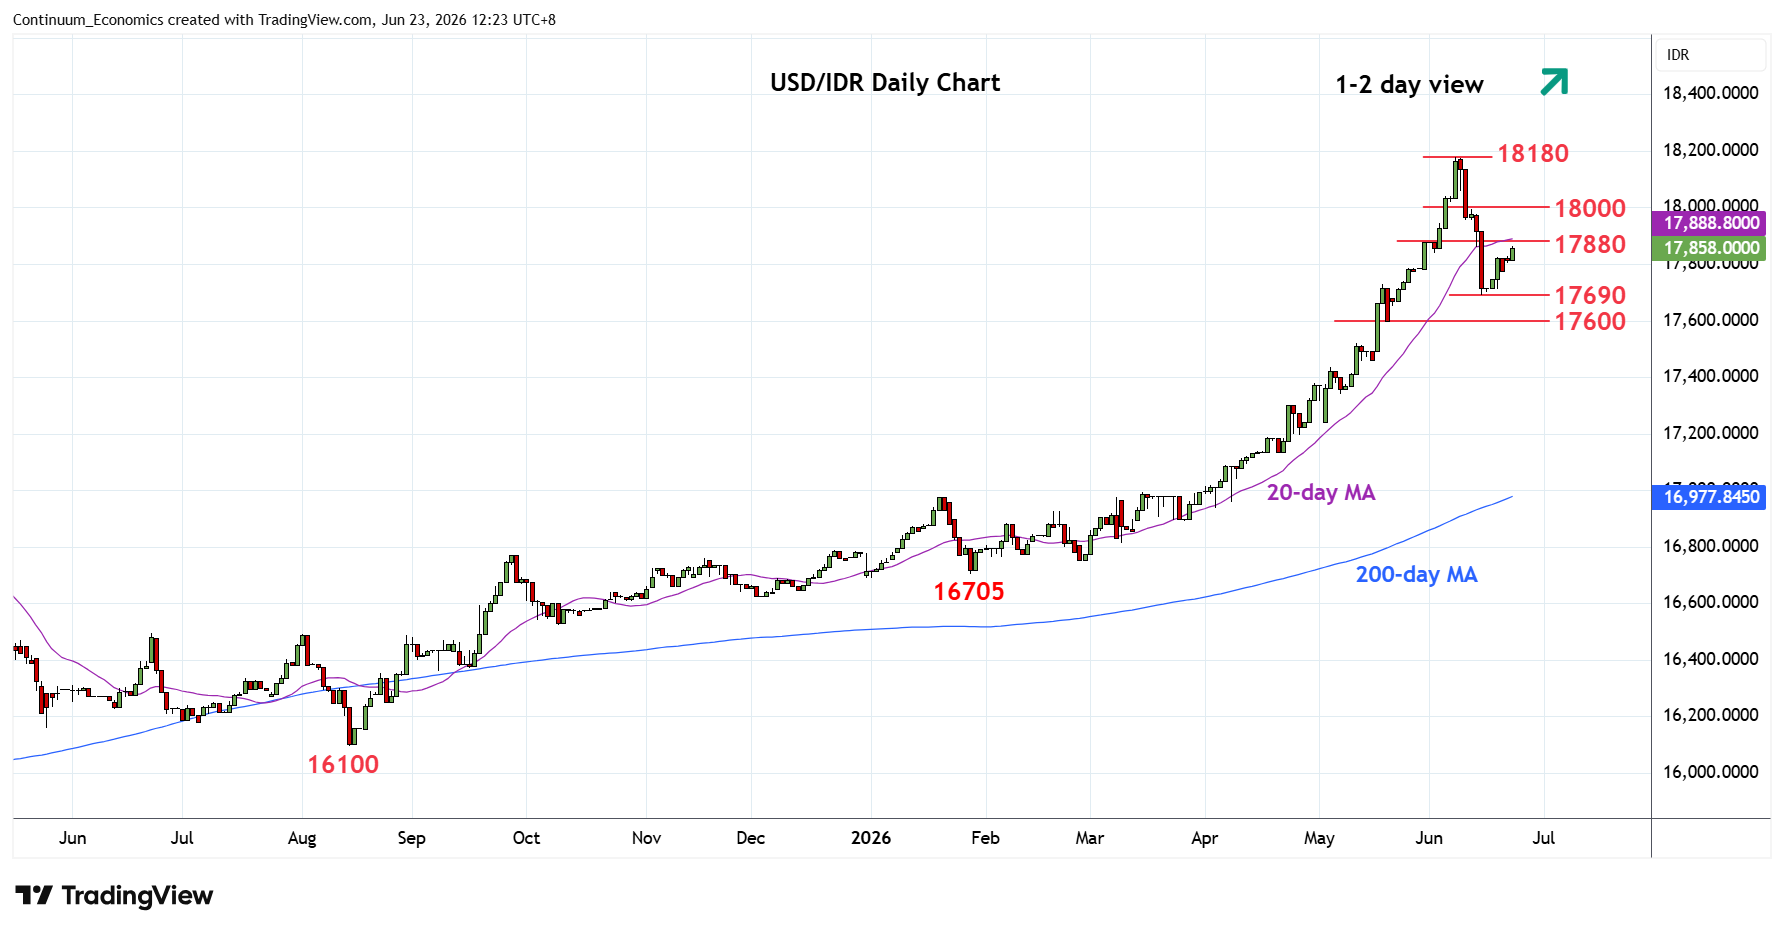
Extending bounce from 17690 low as prices unwind oversold intraday and daily studies
| Levels | Imp | Comment | Levels | Imp | Comment | |||
|---|---|---|---|---|---|---|---|---|
| R4 | 18200 | projection | S1 | 17690 | ** | 15 Jun low | ||
| R3 | 18180 | ** | 8 Jun all-time high | S2 | 17600 | * | 38.2% Jan/Jun rally | |
| R2 | 18000 | * | figure | S3 | 17520 | * | 12 May high | |
| R1 | 17880 | * | 29 May high | S4 | 17440 | * | 5 May high, 50% |
Asterisk denotes strength of level
04:30 GMT - Extending bounce from 17690 low as prices unwind oversold intraday and daily studies. Consolidation here is expected to give way to renewed selling pressure later and see room to extend losses from the 18180, June all-time high. Below 17690 will see room to further retrace gains from the 16705 January YTD low to support at 17600, 38.2% Fibonacci level. Lower still, will see scope to 17520/17500 congestion area and 17440, 50% Fibonacci level. Meanwhile, resistance at the 17840/17880 congestion area then the 18000 figure, expected to cap.