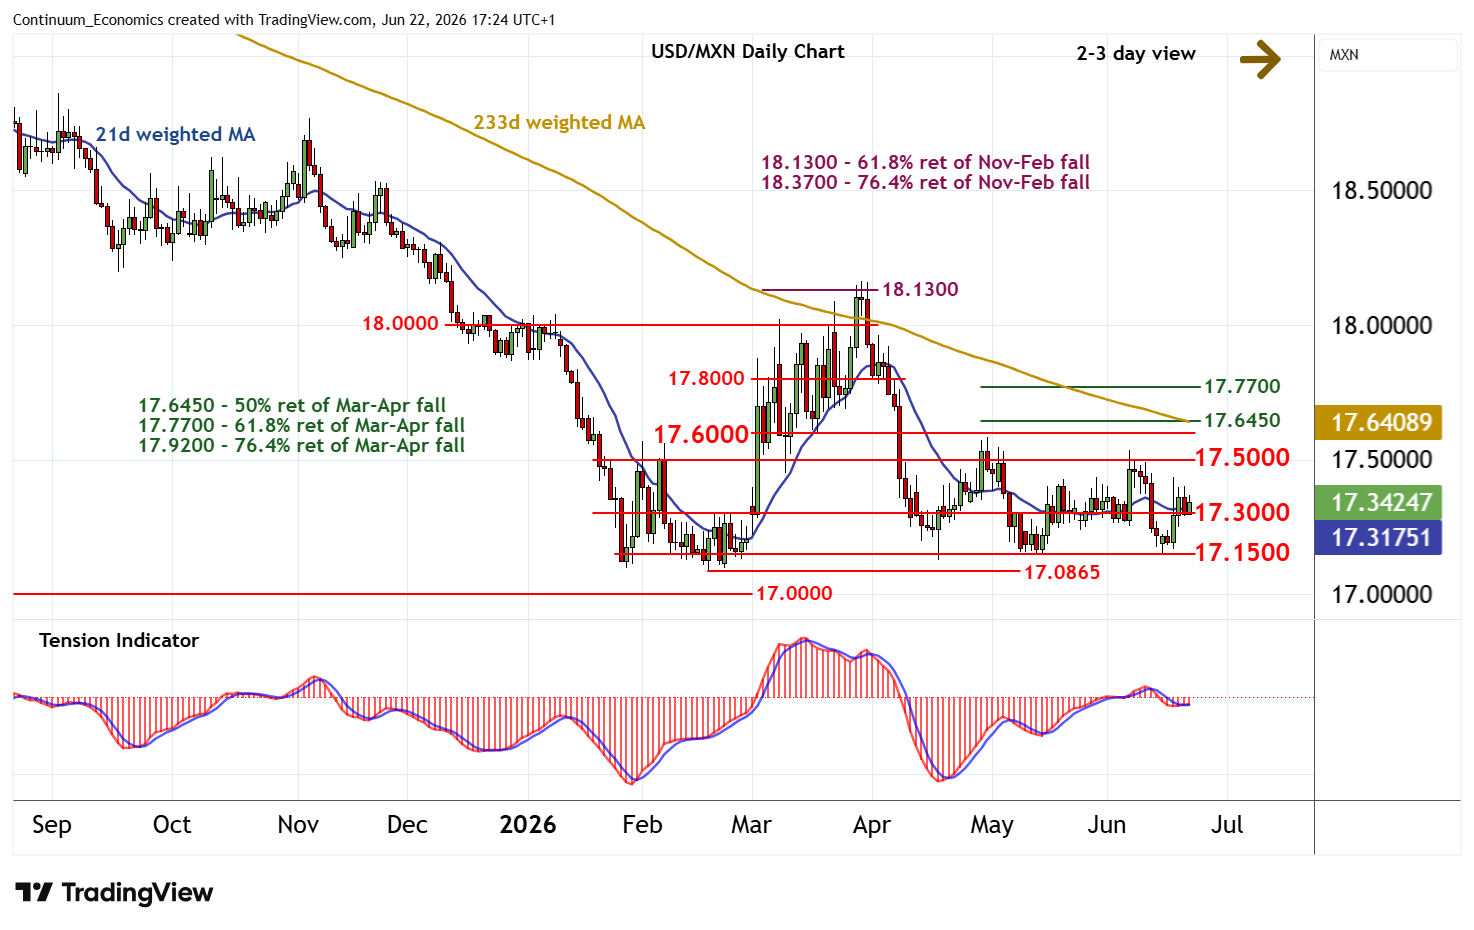
Chart USD/MXN Update: Range extension
The test of congestion resistance at 17.5000 has been followed by a pullback to support at congestion around 17.1500
| Levels | Imp | Comment | Levels | Imp | Comment | |||
|---|---|---|---|---|---|---|---|---|
| R4 | 17.7700 | ** | 61.8% ret of Mar-Apr fall | S1 | 17.3000 | * | break level | |
| R3 | 17.6450 | ** | 50% ret of Mar-Apr fall | S2 | 17.1500 | * | congestion | |
| R2 | 17.6000 | ** | congestion | S3 | 17.1270 | * | 17 Apr (m) low | |
| R1 | 17.5000 | ** | congestion | S4 | 17.0865 | ** | 18 Feb YTD low |
Asterisk denotes strength of level
17:00 BST - The test of congestion resistance at 17.5000 has been followed by a pullback to support at congestion around 17.1500, before settling into consolidation around 17.3000. Both daily and weekly studies are mixed, highlighting room for further range extension within the broad 17.1500 - 17.5000 range. A close above 17.5000 would improve sentiment. But a further close above further congestion around 17.6000 is needed to turn price action positive and extend May gains towards the 17.6450 Fibonacci retracement. Meanwhile, a close below the 17.0865 current year low of 18 February would turn sentiment negative and confirm continuation of February 2025 losses.