Published: 2026-08-18T02:53:31.000Z
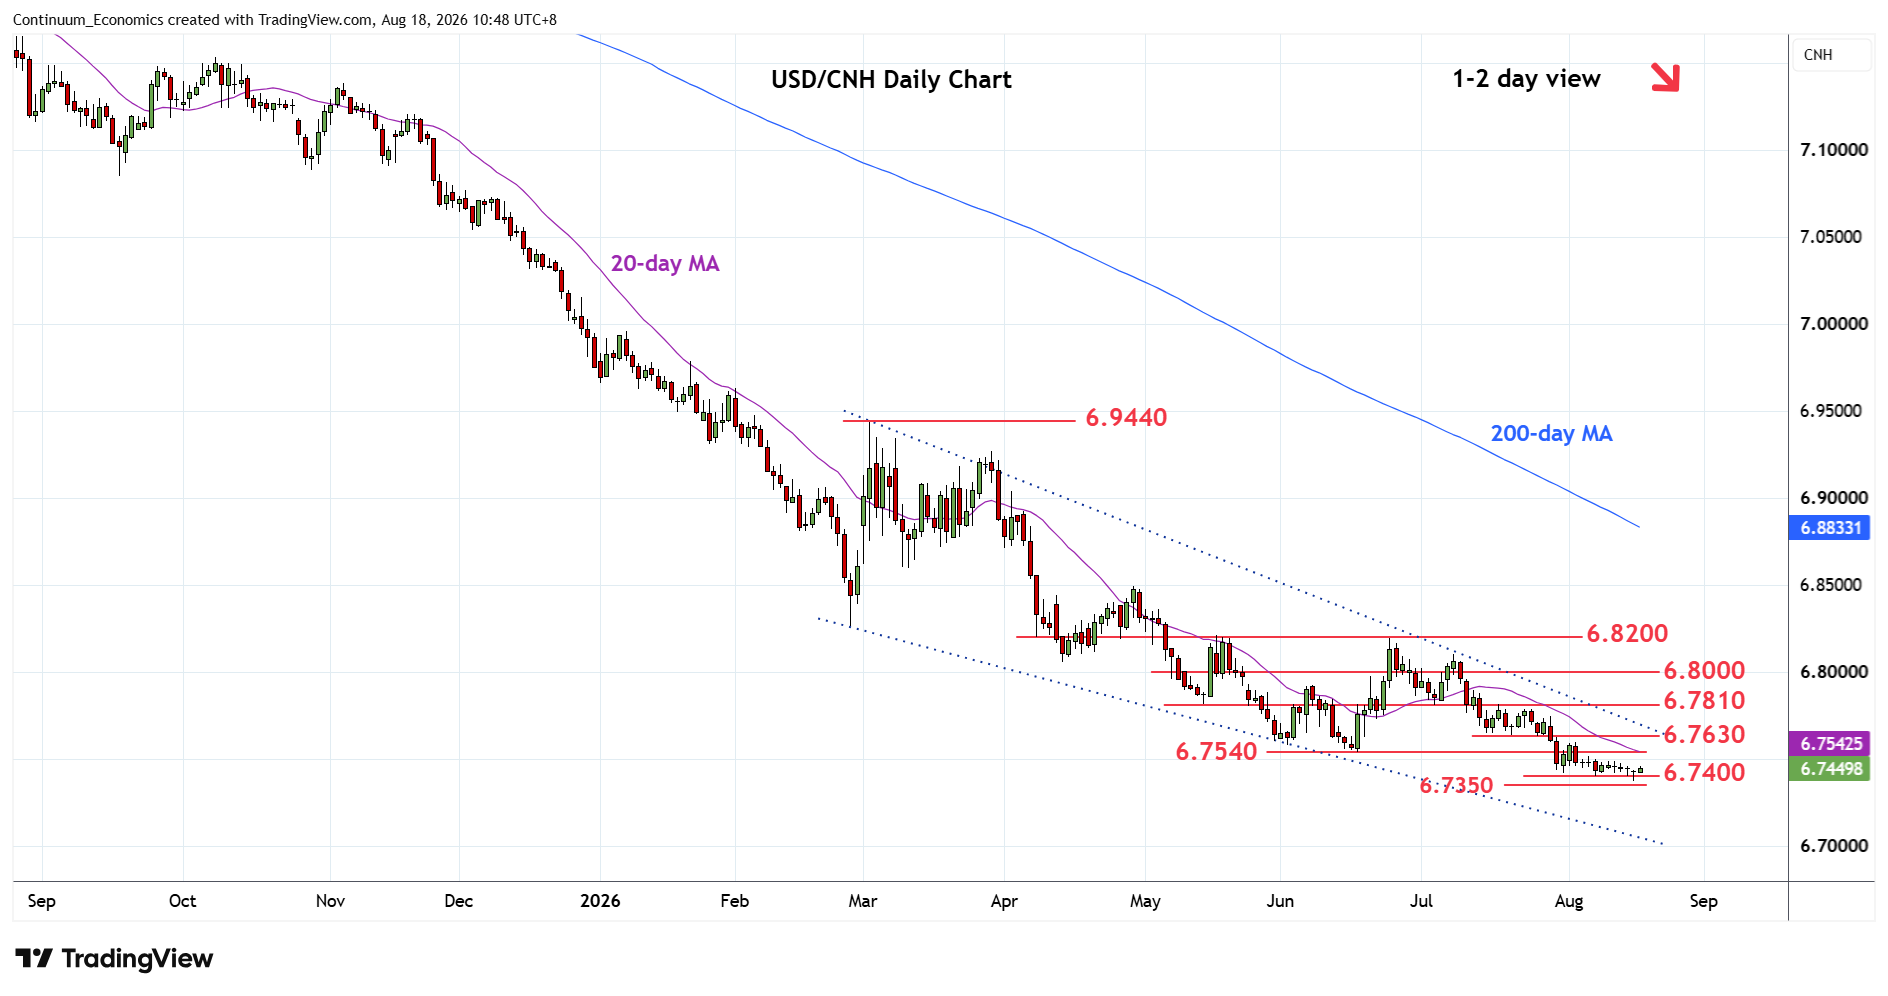
Chart USD/CNH Update: Turned up from fresh year low at 6.7375
3
Edged to fresh year low at 6.7375 before turning up as prices unwind the oversold intraday and daily studies
| Level | Imp | Comment | Level | Imp | Comment | |||
|---|---|---|---|---|---|---|---|---|
| R4 | 6.8000 | * | congestion | S1 | 6.7375 | ** | 17 Aug YTD low | |
| R3 | 6.7800 | ** | 3 Jul low | S2 | 6.7350 | * | 61.8% 2022/2025 rally | |
| R2 | 6.7630 | * | 21 Jul low | S3 | 6.7200 | * | congestion | |
| R1 | 6.7540 | ** | Jun low | S4 | 6.7000 | ** | 2023 year low |
Asterisk denotes strength of level
02:50 GMT - Edged to fresh year low at 6.7375 before turning up as prices unwind the oversold intraday and daily studies. Further losses cannot be ruled out and lower will see room to extend the bear trend from the April 2025 year high to target support at 6.7350 Fibonacci level. Lower still, will see extension to the 6.7200 congestion and 6.7000, 2023 year low. However, divergence on weekly studies caution corrective bounce with resistance starting at 6.7540, June low. Above here will open up room for strong corrective bounce to retrace losses from the 6.8200 high.