Published: 2026-05-25T04:56:20.000Z
Chart USD/INR Update: Extending pullback from 96.9600 historic high
2
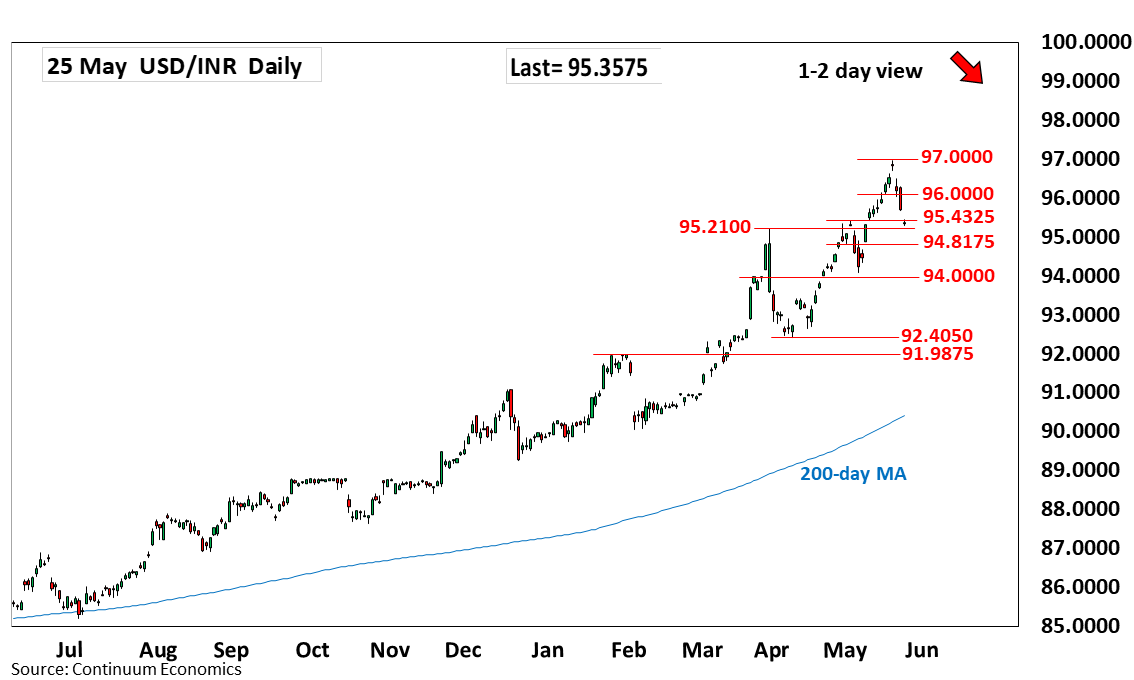
Under pressure as prices extend pullback from the 96.9600 historic high
| Level | Comment | Level | Comment | |||||
|---|---|---|---|---|---|---|---|---|
| R4 | 97.5000 | figure | S1 | 95.2100 | ** | Mar high | ||
| R3 | 97.1000 | projection | S2 | 94.8175 | * | 4 May low | ||
| R2 | 96.9600 | ** | 20 May all-time high | S3 | 94.0800 | ** | May low | |
| R1 | 96.0000 | ** | figure, congestion | S4 | 93.4100 | ** | 15 Apr high |
Asterisk denotes strength of level
04:50 GMT - Under pressure as prices extend pullback from the 96.9600 historic high. Gapped down at the open has seen losses to pressure strong support at 95.4325 and 95.2100, the 5 May and March highs. Break here will fade the upside pressure and see room for deeper pullback to retrace gains from the April low to support at 94.8175 then the 94.0800, May low. Meanwhile, resistance is lowered to the 96.0000 congestion which is expected to cap corrective bounce and sustain losses from the 96.9000, 20 May all-time high