Published: 2026-05-19T04:00:53.000Z
Chart USD/IDR Updates: Extending gains
2
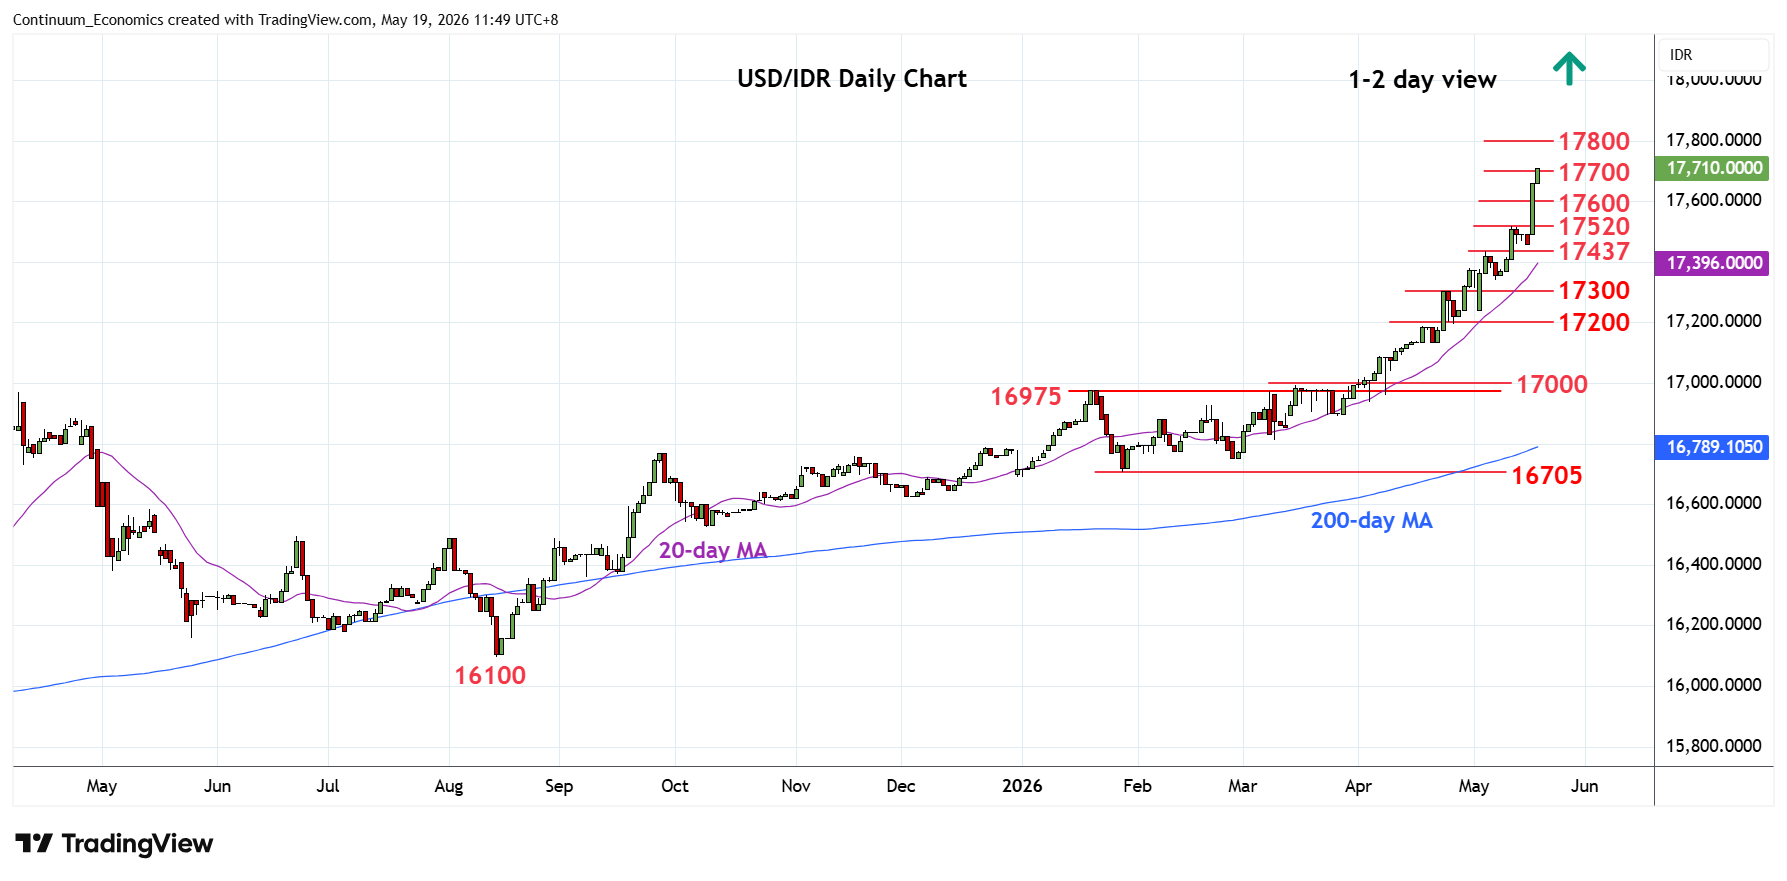
Sharply higher as prices extend break of the 17520 high of last week to reach fresh historic high at 17710
| Levels | Imp | Comment | Levels | Imp | Comment | |||
|---|---|---|---|---|---|---|---|---|
| R4 | 18500 | figure | S1 | 17600 | congestion | |||
| R3 | 18000 | ** | figure | S2 | 17520 | * | 12 May high | |
| R2 | 17800 | projection | S3 | 17437 | * | 5 May high | ||
| R1 | 17710 | intraday high | S4 | 17300 | * | 23 Apr high |
Asterisk denotes strength of level
04:00 GMT - Sharply higher as prices extend break of the 17520 high of last week to reach fresh historic high at 17710. Bullish structure keep pressure on the upside and see room for further parabolic gains from the 16705 January year low to 17800 projection targets then the 18000 figure. Would expect reaction here as daily and weekly studies extend into overbought areas and caution corrective pullback. Meanwhile, support is raised to the 17600 level which extend to 17520 high of last week. Would take break here to ease the upside pressure and see deeper corrective pullback.