Published: 2026-05-21T04:15:30.000Z
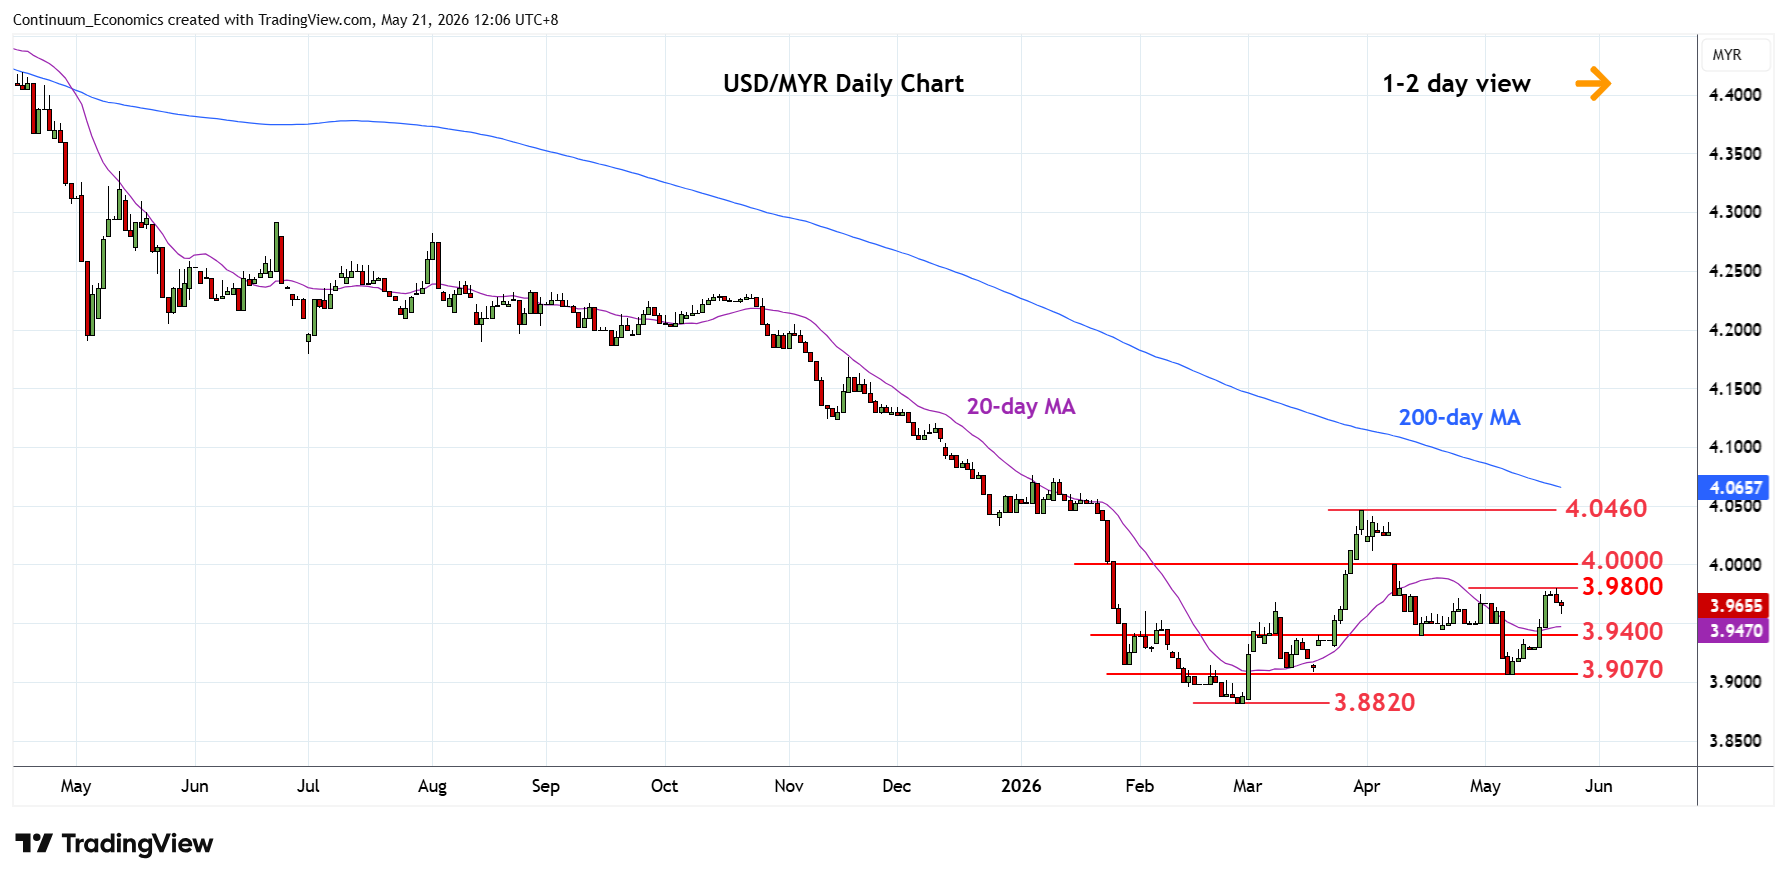
Chart USD/MYR Update: Settling back from 3.9800 high
1
Extend pullback from the 3.9800 high as prices consolidate gains from the 3.9070 low of 7 May
| Levels | Imp | Comment | Levels | Imp | Comment | |||
|---|---|---|---|---|---|---|---|---|
| R4 | 4.0460 | ** | 31 Mar high | S1 | 3.9400 | * | 15 Apr low | |
| R3 | 4.0200 | * | congestion | S2 | 3.9070 | ** | 7 May low | |
| R2 | 4.0000 | ** | figure | S3 | 3.8820 | ** | 26 Feb YTD low | |
| R1 | 3.9800 | * | 20 May high | S4 | 3.8680 | * | Jan 2018 low |
Asterisk denotes strength of level
04:10 GMT - Extend pullback from the 3.9800 high as prices consolidate gains from the 3.9070 low of 7 May. Daily studies are unwinding overbought readings and suggest scope for pullback to support at the 3.9500/3.9400 area. Below these will return focus to the downside for retest of the 3.9070 low and where break will expose the 3.8820 February current year low to retest. Meanwhile, resistance at the 3.9700/3.9800 area expected to cap. Clearance will open up room for stronger gains to the 4.0000 figure which is expected to cap.