Published: 2026-07-14T05:12:08.000Z
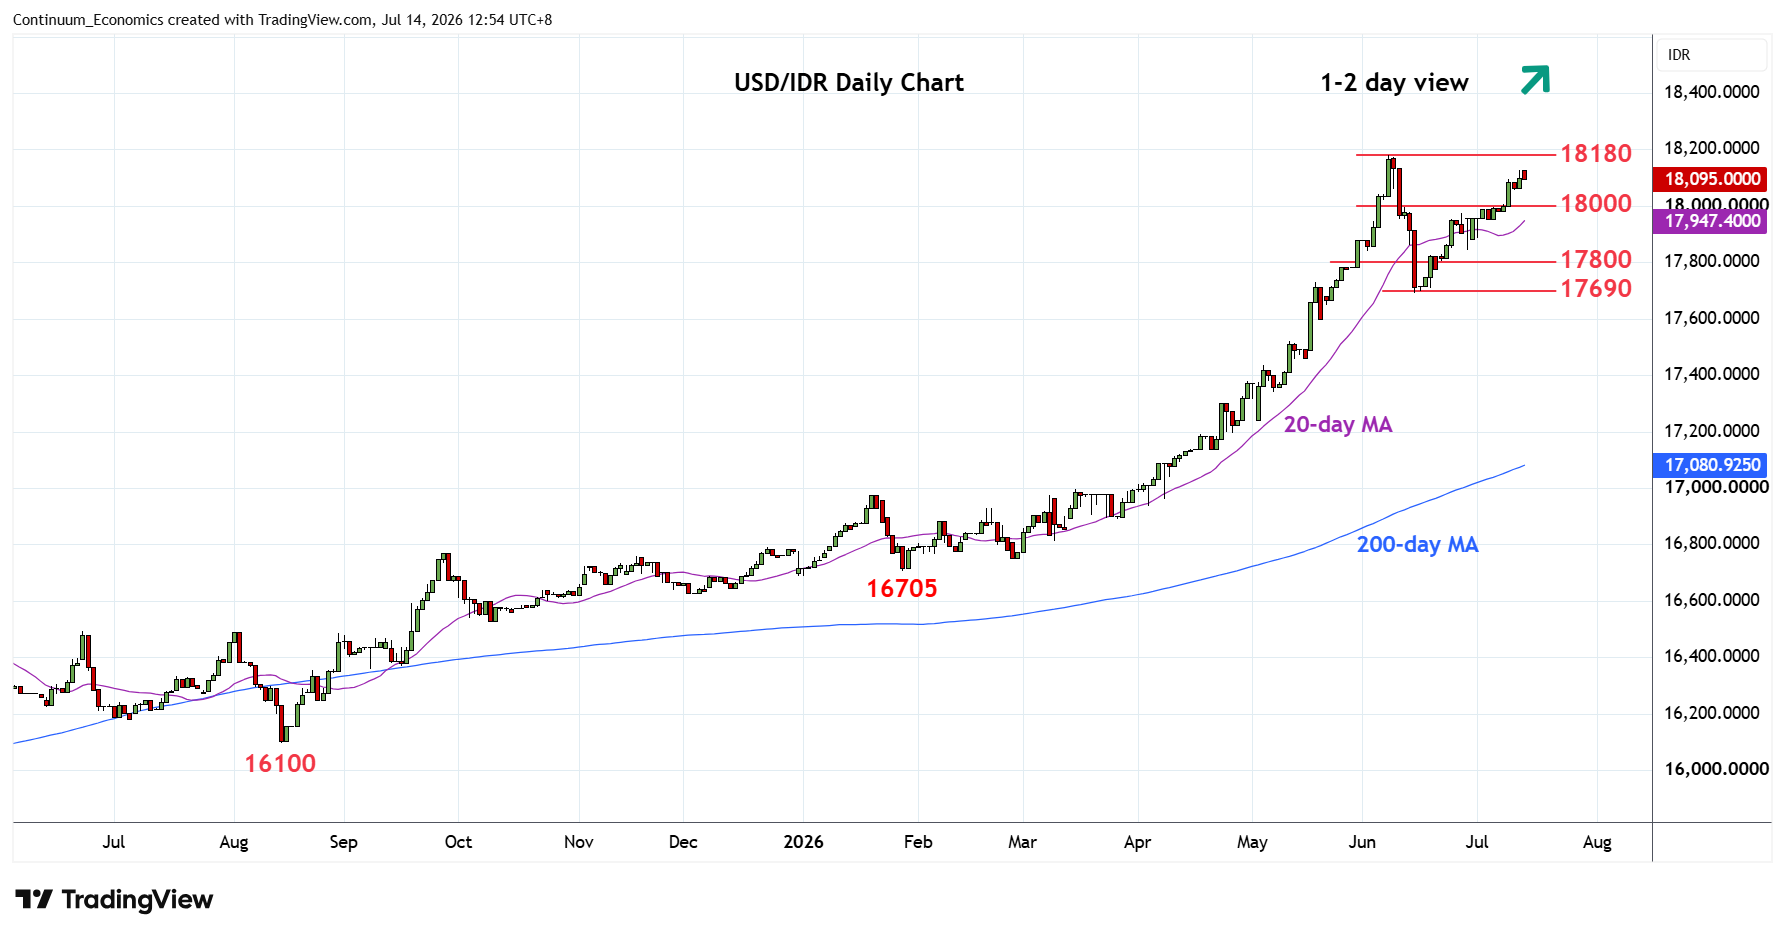
Chart USD/IDR Updates: Within reach of 18180 high
7
Edged lower from 18126 Monday's high as prices unwind overbought intraday studies
| Levels | Imp | Comment | Levels | Imp | Comment | |||
|---|---|---|---|---|---|---|---|---|
| R4 | 18470 | projection | S1 | 18000 | * | congestion | ||
| R3 | 18200 | projection | S2 | 17845 | * | 29 Jun low | ||
| R2 | 18180 | ** | 8 Jun all-time high | S3 | 17800 | * | congestion | |
| R1 | 18126 | * | 13 Jul high | S4 | 17690 | ** | 15 Jun low |
Asterisk denotes strength of level
05:10 GMT - Edged lower from 18126 Monday's high as prices unwind overbought intraday studies. Further gains will see room for retest of the 18180 all-time high but daily studies are overbought and divergence on weekly chart suggest the latter likely to cap on retest. Meanwhile, support remains at the 18000 level. Would take break here to open up room for deeper pullback to retrace strong gains from the 17690 June low and see room to support at the 17845/17800 area. Lower will expose the 17690 low to retest and see scope to extend losses from the 18180 high.