Published: 2026-09-24T05:34:36.000Z
Chart USD/IDR Updates: Consolidating test of 17880/17900 resistance
3
Extend consolidation beneath the 17880/17900 resistance as prices unwind the overbought intraday and daily studies
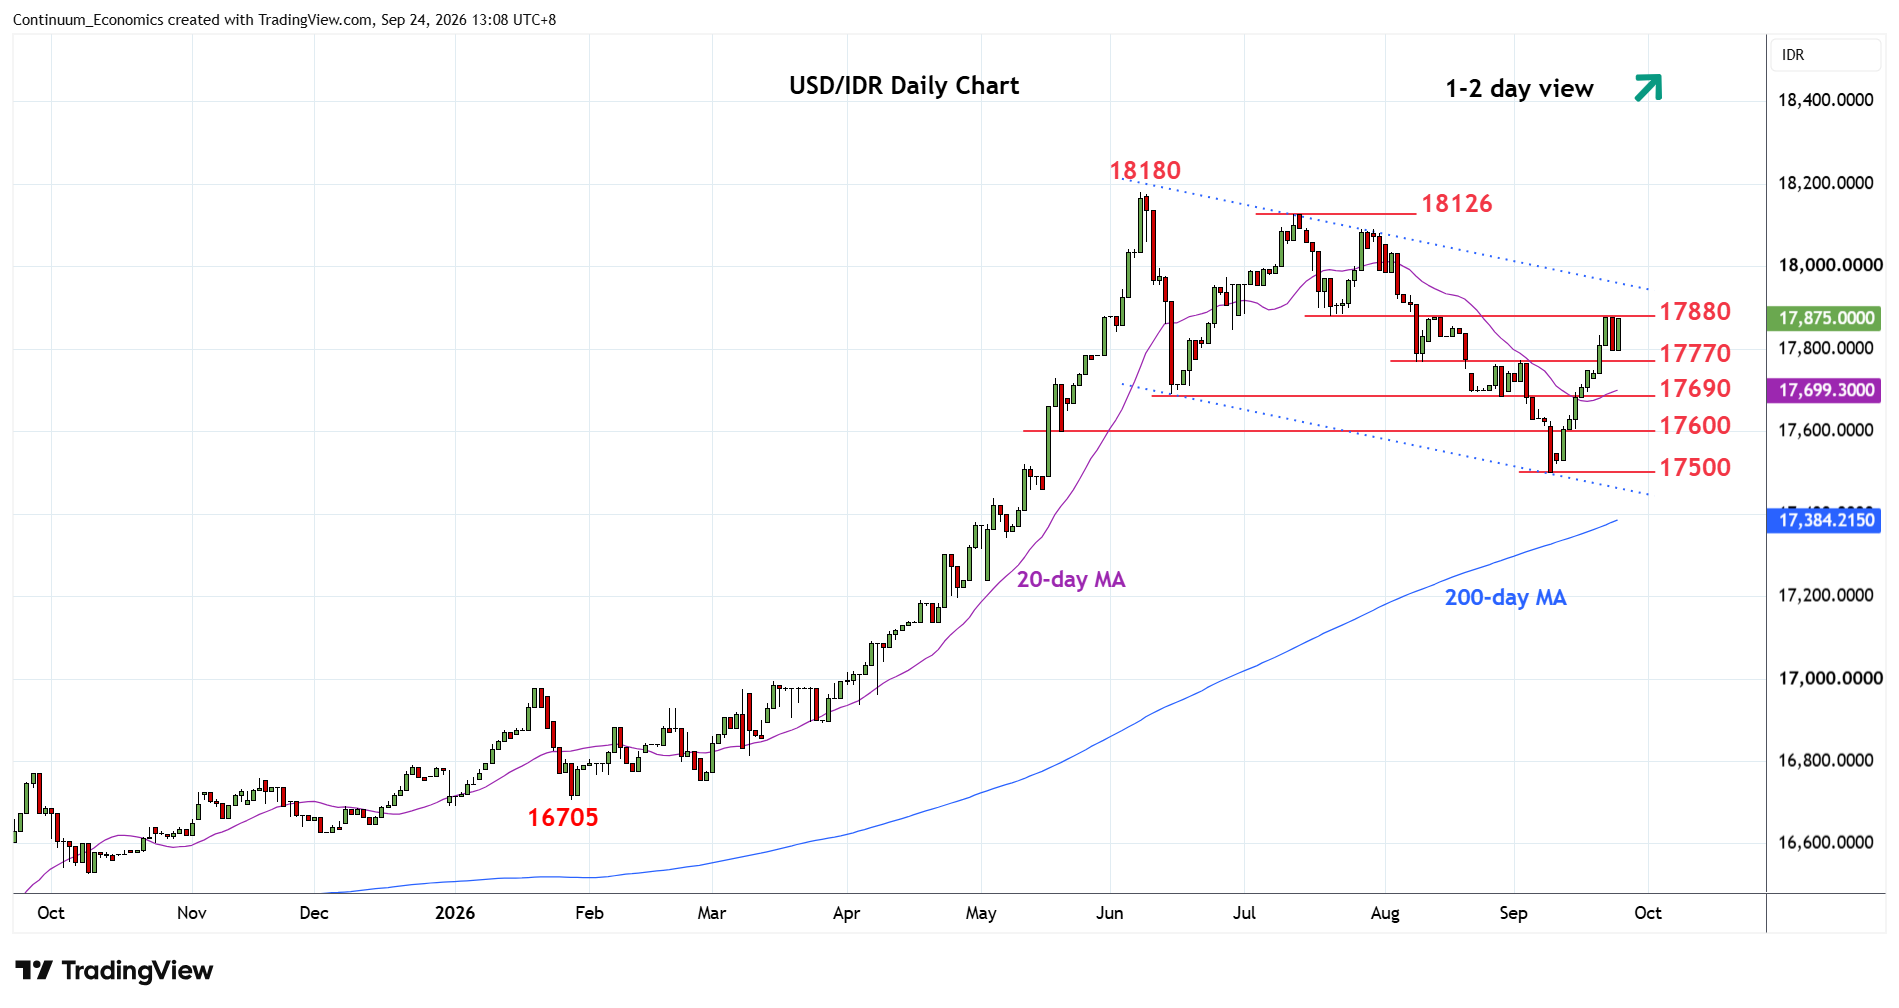
| Levels | Imp | Comment | Levels | Imp | Comment | |||
|---|---|---|---|---|---|---|---|---|
| R4 | 18126 | ** | 13 Jul high | S1 | 17770 | * | 10 Aug low | |
| R3 | 18090 | * | 28 Jul high | S2 | 17690 | ** | Jun low | |
| R2 | 18000 | * | figure | S3 | 17600 | * | congestion | |
| R1 | 17880/900 | ** | Jul low, congestion | S4 | 17500 | ** | 9 Sep low |
Asterisk denotes strength of level
05:30 GMT - Extend consolidation beneath the 17880/17900 resistance as prices unwind the overbought intraday and daily studies. The resulting flag pattern suggest scope for break here to extend bullish gains from the 17500, 9 September low. Clearance will see room to channel resistance at 17960 then the 18000 level. Meanwhile, support at the 17770 congestion and 10 August low should underpin. Break here will expose the June low at 17690 to retest. Below the latter will fade the upside pressure and see return to the 17600 congestion and the 17500 low.