Published: 2026-09-03T06:38:49.000Z
Chart USD/TWD Update: Higher in consolidation from 31.600 support
1
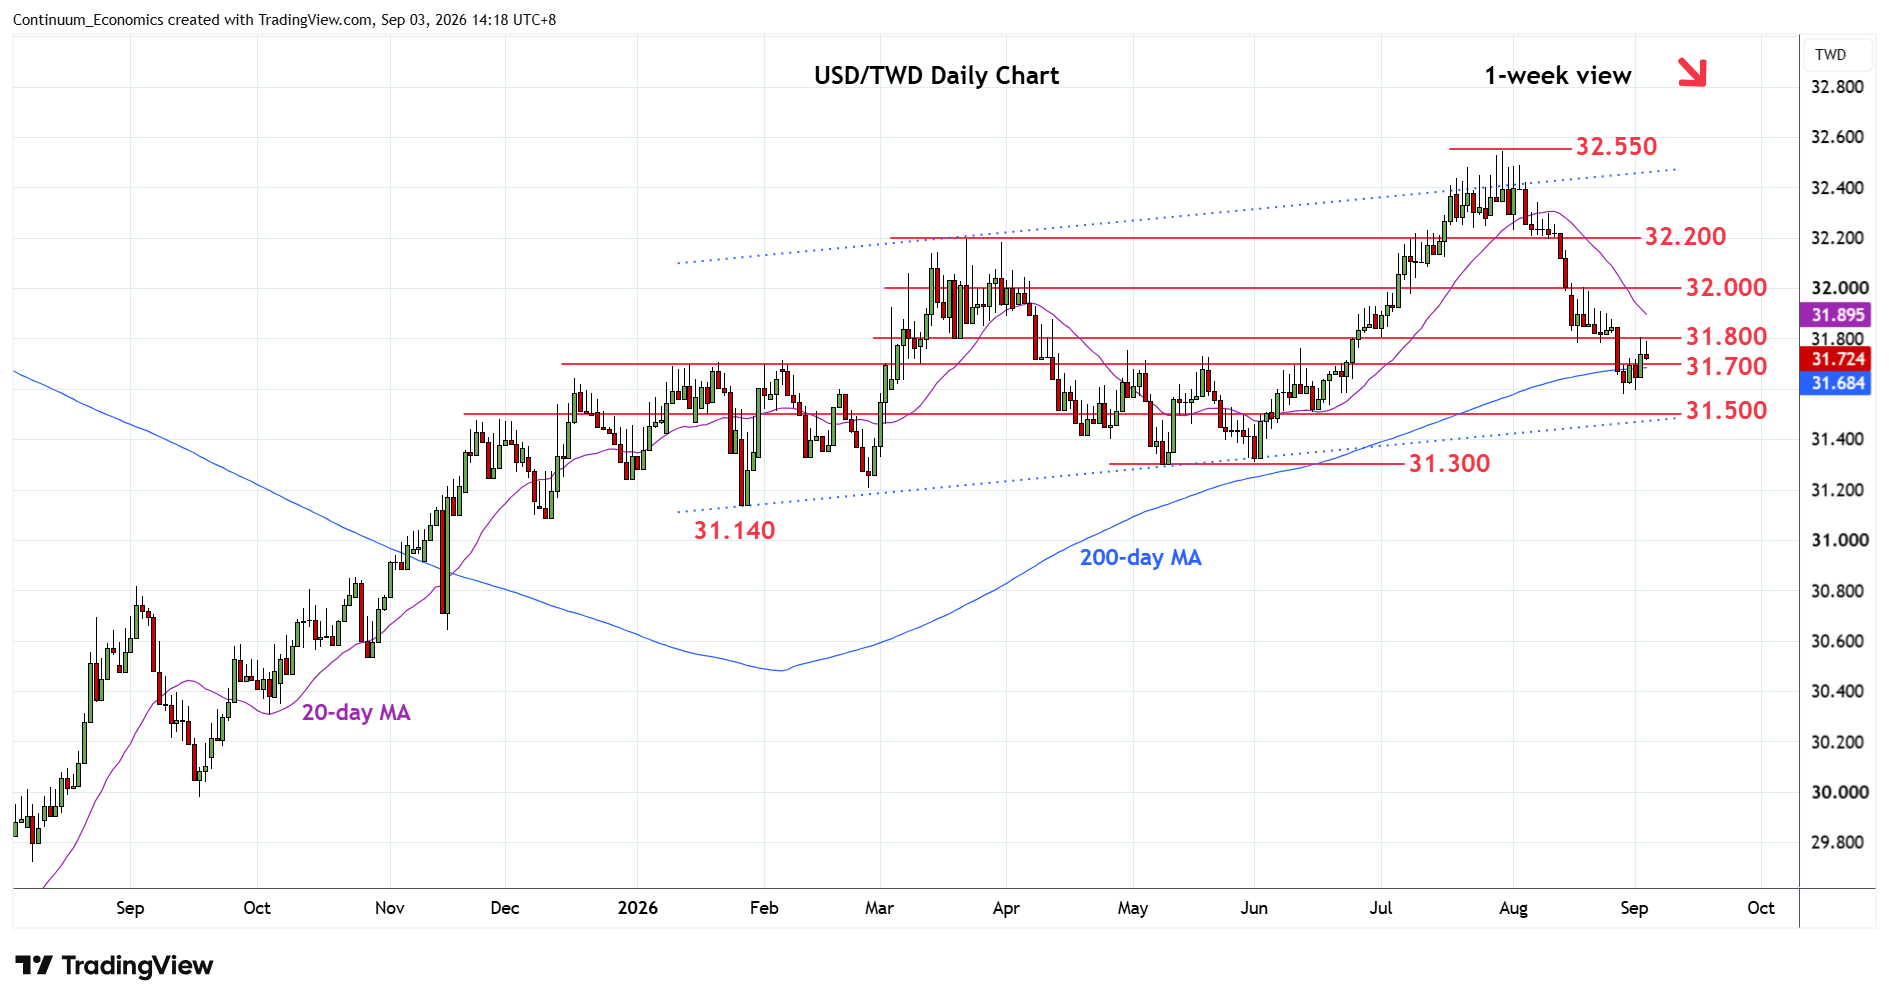
Steadied at the 31.600 congestive support as prices consolidate sharp losses from the 32.550, July current year high
| Levels | Imp | Comment | Levels | Imp | Comment | |||
|---|---|---|---|---|---|---|---|---|
| R4 | 32.100 | * | congestion | S1 | 31.700 | * | Jan high, congestion | |
| R3 | 32.000 | ** | figure, congestion | S2 | 31.600 | ** | congestion | |
| R2 | 31.900 | * | congestion | S3 | 31.500 | * | congestion | |
| R1 | 31.800 | * | congestion | S4 | 31.400 | * | Apr low, congestion |
06:30 GMT - Steadied at the 31.600 congestive support as prices consolidate sharp losses from the 32.550, July current year high. Daily studies have turned up to unwind oversold reading to reach resistance at the 31.800 level. Above here will open up room for stronger corrective gains to 31.900 congestion then the 32.000 level which is expected to cap and meet with renewed selling pressure later. Meanwhile, support is raised to the 31.700 high of January which should underpin and sustain bounce from the 31.600 low. A later break of the latter will extend losses towards 31.500/31.400 area then the 31.300, May low.