Published: 2026-06-17T02:49:31.000Z
Chart USD/MYR Update: Consolidating, room for higher later
1
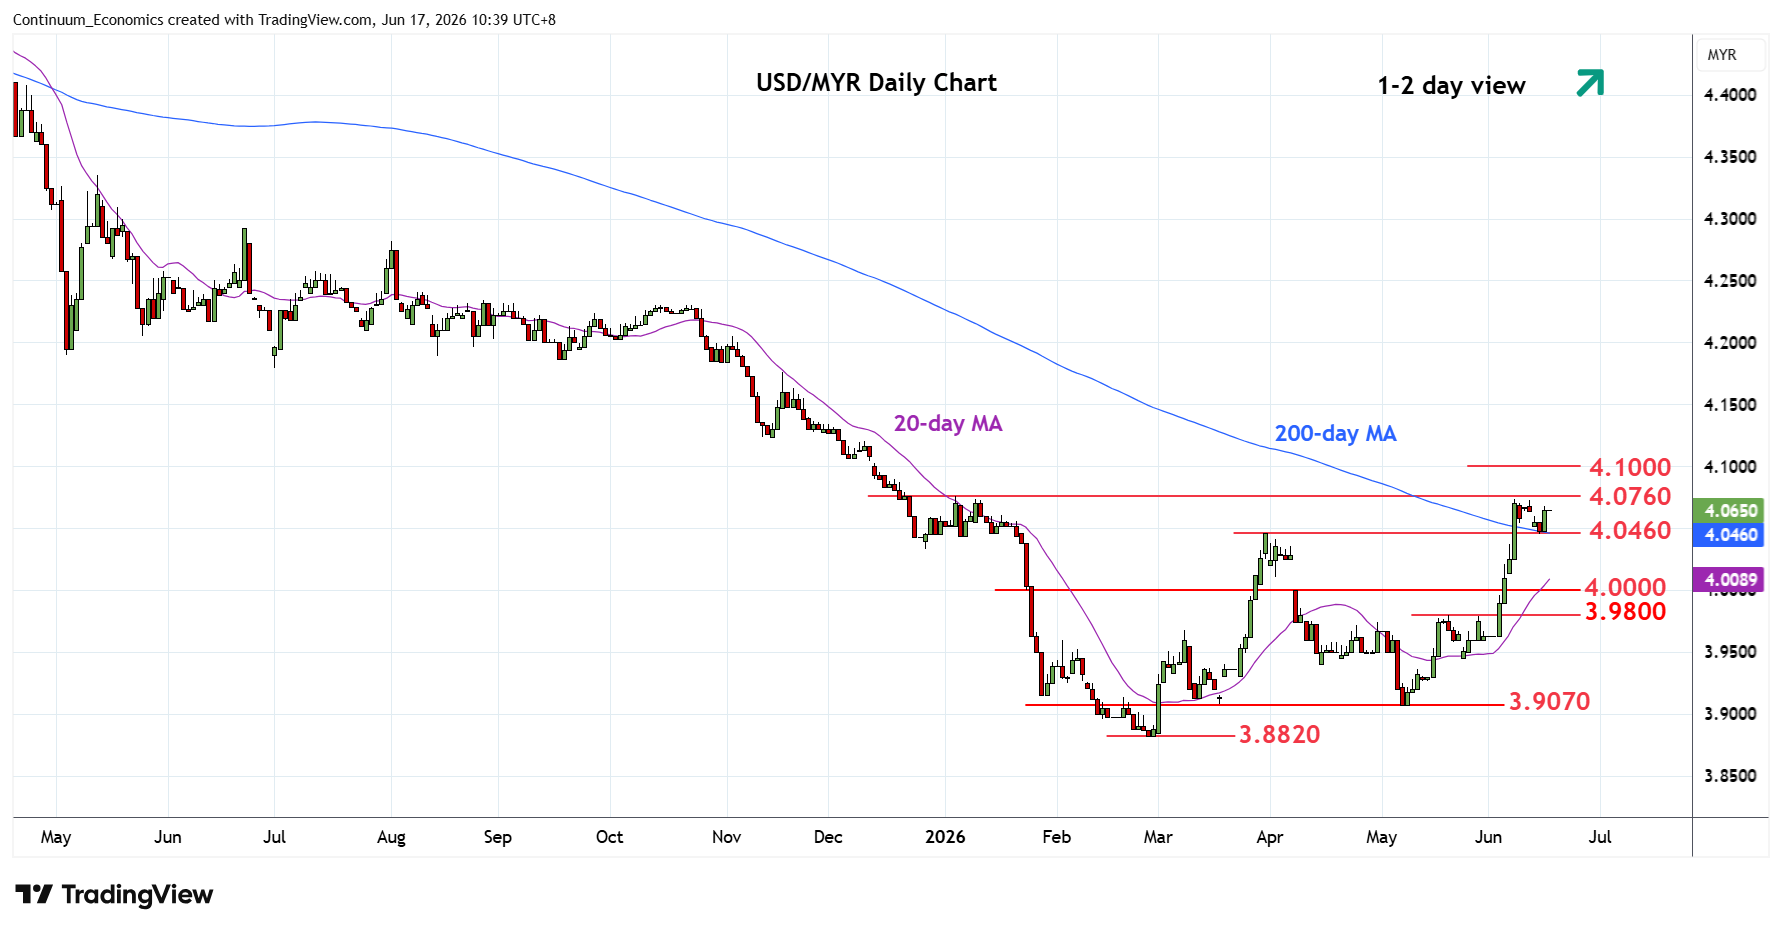
Lower in consolidation beneath strong resistance at 4.0760 January YTD high as prices unwind overbought and daily studies
| Levels | Imp | Comment | Levels | Imp | Comment | |||
|---|---|---|---|---|---|---|---|---|
| R4 | 4.1240 | ** | Nov 2025 low, 38.2% | S1 | 4.0460 | * | Mar high | |
| R3 | 4.1200 | * | congestion | S2 | 4.0250 | 8 Jun low | ||
| R2 | 4.1000 | ** | figure, 2024 yr low | S3 | 4.0000 | * | figure | |
| R1 | 4.0760 | ** | 5 Jan YTD high | S4 | 3.9800 | ** | May high |
Asterisk denotes strength of level
02:50 GMT - Lower in consolidation beneath strong resistance at 4.0760 January YTD high as prices unwind overbought and daily studies. The resulting flag pattern scope for break higher to extend the broader gains from the February low to retrace losses from the January 2025 year high. Higher will see room for extension to resistance at the 4.1000 figure and 2024 year low. Meanwhile, support is at 4.0460 March high. Would take break here to open up room for pullback to support at the 4.0250/4.0000 congestion.