Published: 2026-05-26T04:38:57.000Z
Chart USD/MYR Update: Higher in consolidation from 3.9500/3.9400 support
1
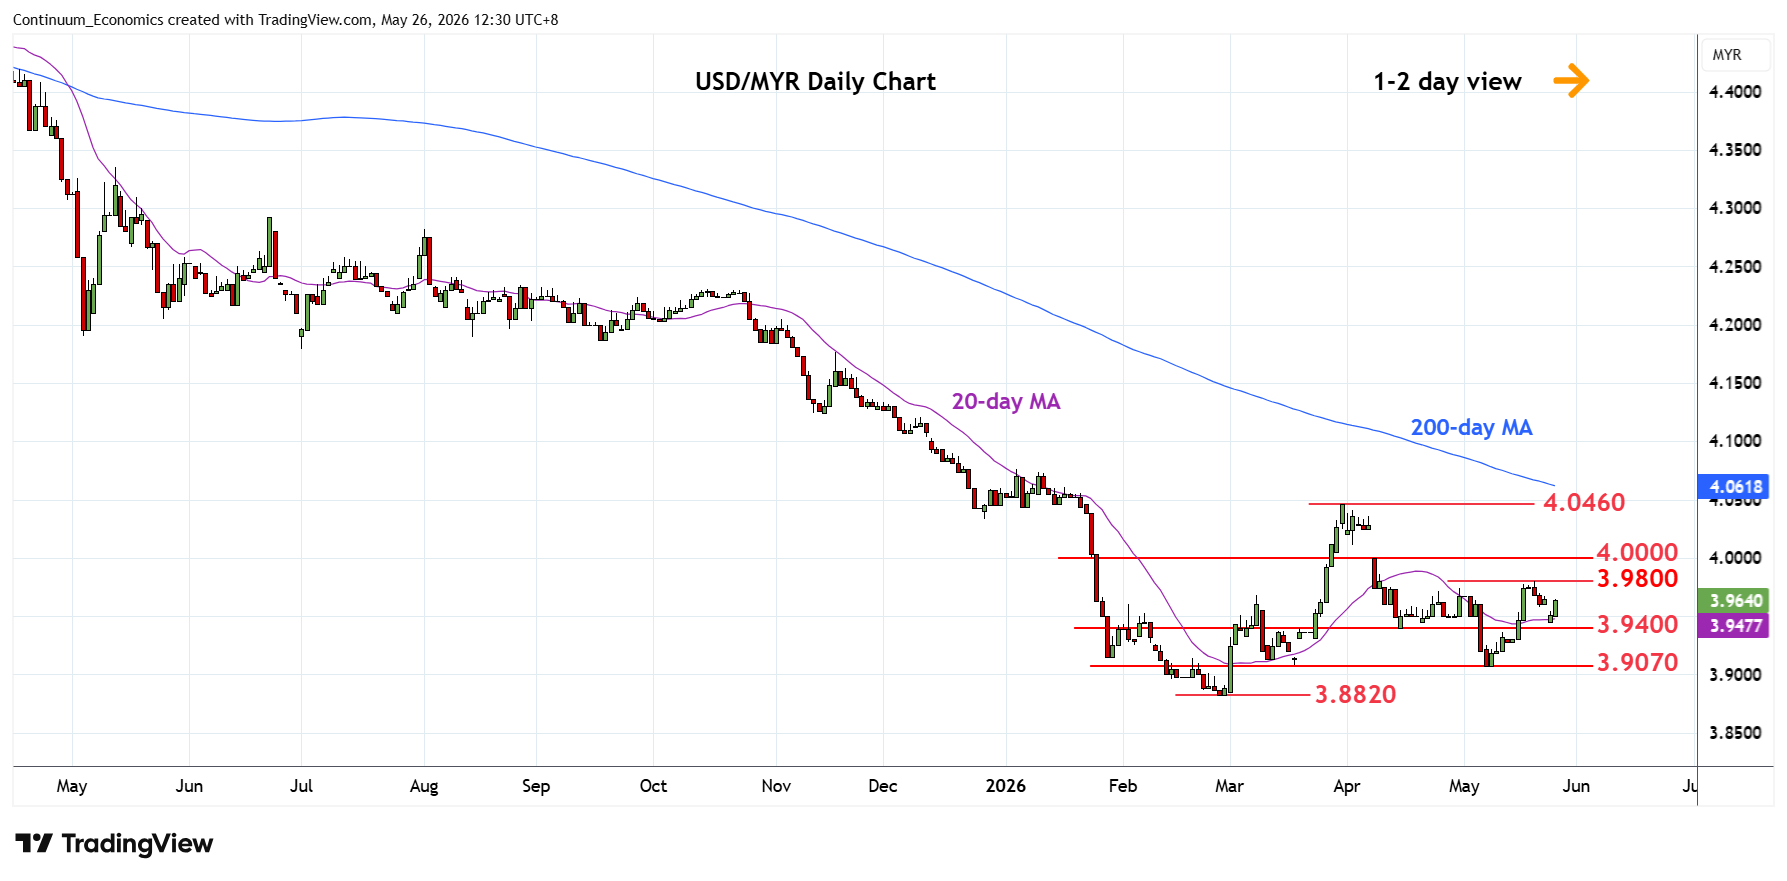
Bounce from the 3.9500/3.9400 support see potential for retest of the 3.9800 high of last week
| Levels | Imp | Comment | Levels | Imp | Comment | |||
|---|---|---|---|---|---|---|---|---|
| R4 | 4.0460 | ** | 31 Mar high | S1 | 3.9400 | * | 15 Apr low | |
| R3 | 4.0200 | * | congestion | S2 | 3.9070 | ** | 7 May low | |
| R2 | 4.0000 | ** | figure | S3 | 3.8820 | ** | 26 Feb YTD low | |
| R1 | 3.9800 | * | 20 May high | S4 | 3.8680 | * | Jan 2018 low |
Asterisk denotes strength of level
04:30 GMT - Bounce from the 3.9500/3.9400 support see potential for retest of the 3.9800 high of last week. Above the latter will see room to extend gains from the 3.9070 low of 7 May to retrace losses from the 4.0460 March high and see room for extension to the 4.0000 figure which is expected to cap. Break here, if seen, will return focus to the 4.0460 high. Meanwhile, break of the 3.9500/3.9400 support will return focus to the downside for retest of the 3.9070 low and see scope for deeper pullback to retest the 3.8820 February current year low.