Weekly Chart USD/MXN Update: Balanced just above year lows - studies under pressure
Cautious trade within the broad 16.3000 - 16.5000 range is giving way to fresh losses
| Levels | Imp | Comment | Levels | Imp | Comment | |||
|---|---|---|---|---|---|---|---|---|
| R4 | 17.8500 | * | congestion | S1 | 17.0865 | ** | 18 Feb YTD low | |
| R3 | 17.6000 | ** | congestion | S2 | 17.0000 | ** | congestion | |
| R2 | 17.5000 | ** | congestion | S3 | 16.7000 | * | congestion lows | |
| R1 | 17.3000 | * | break level | S4 | 16.2600 | ** | April 2024 (y) low |
Asterisk denotes strength of level
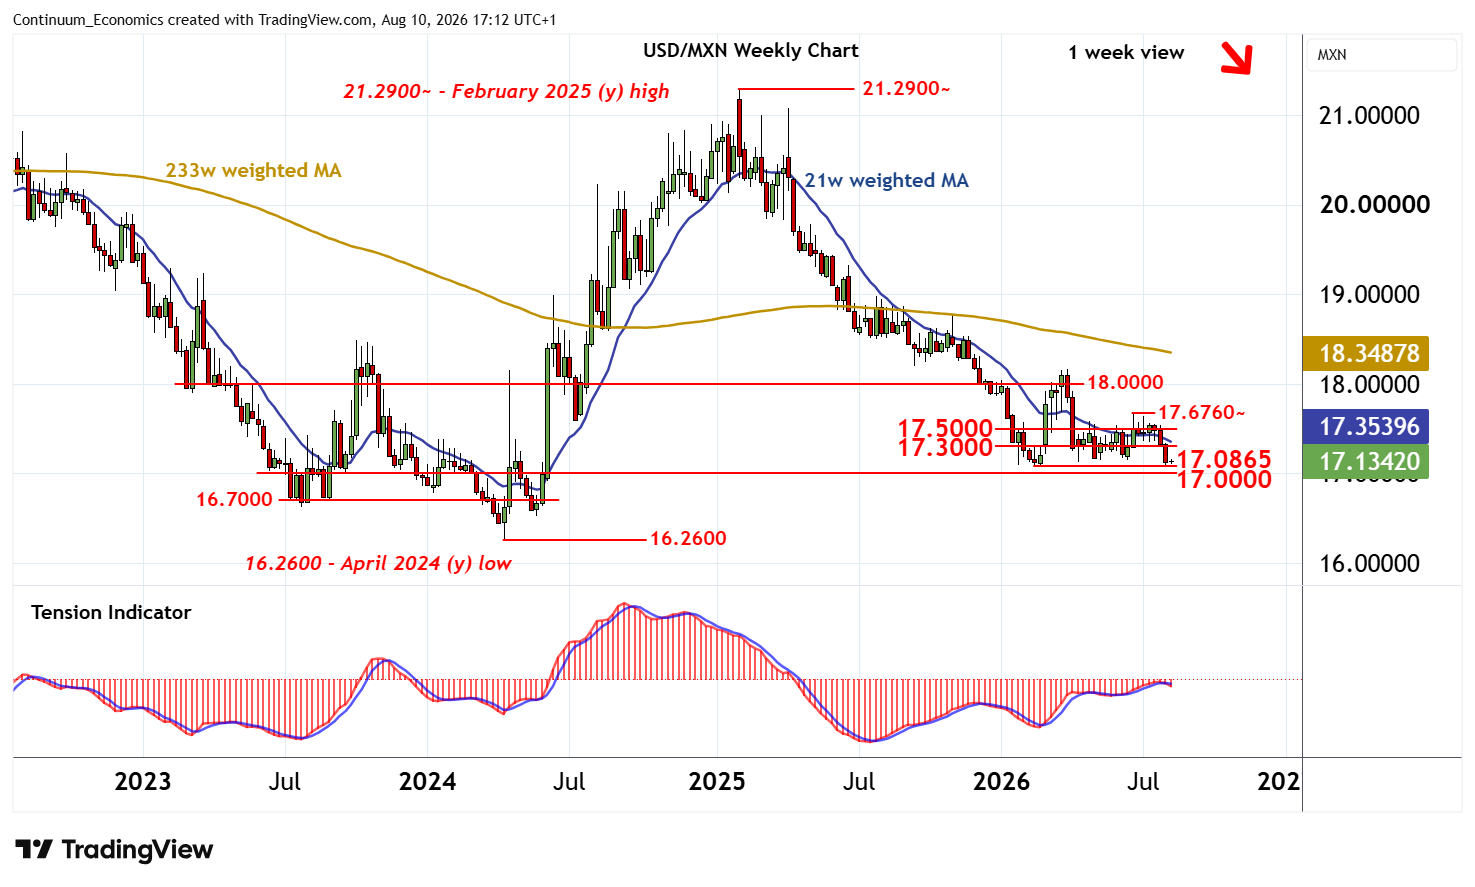
16:50 BST - Cautious trade within the broad 16.3000 - 16.5000 range is giving way to fresh losses, with prices currently consolidating above critical support at the 17.0865 current year low of 18 February. Flat oversold daily stochastics highlight room for further consolidation, before the bearish daily Tension Indicator and negative weekly charts prompt further losses. A close beneath here will add weight to sentiment and extend February 2025 losses below congestion around 17.0000 towards 16.7000. Meanwhile, resistance is at 17.3000. A close back above here would help to stabilise price action and give way to fresh consolidation beneath 17.5000.