Published: 2026-09-23T02:32:16.000Z
Chart USD/SGD Update: Lower in consolidation
2
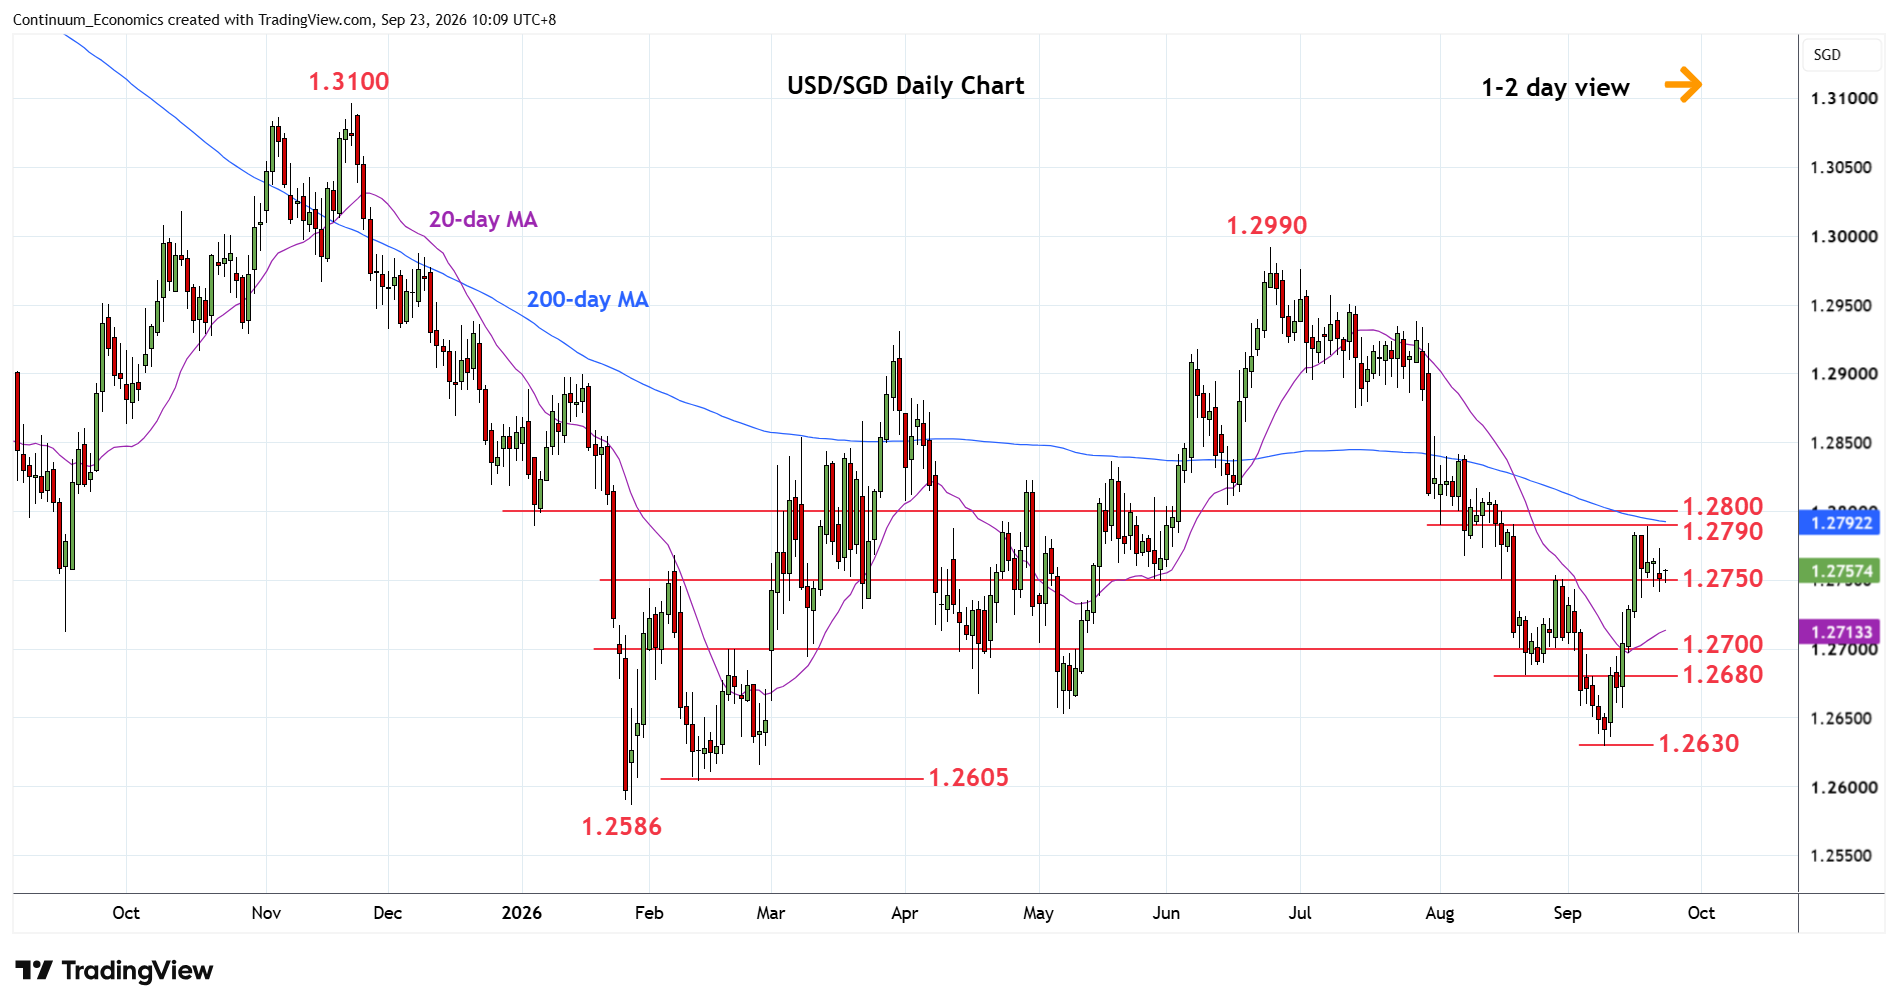
Leaning lower in consolidation following test of the 1.2790/1.2800 resistance and 200-day MA
| Level | Comment | Level | Comment | ||||
|---|---|---|---|---|---|---|---|
| R4 | 1.2875 | ** | 14 Jul low | S1 | 1.2750/30 | * | congestion, 15 Sep high |
| R3 | 1.2850 | * | congestion, 61.8% | S2 | 1.2700 | * | congestion, Jul 2025 yr low |
| R2 | 1.2800/10 | ** | congestion, 50% | S3 | 1.2680 | * | Aug low |
| R1 | 1.2790 | * | 3 Aug low | S4 | 1.2650 | ** | May low |
Asterisk denotes strength of level
02:25 GMT - Leaning lower in consolidation following test of the 1.2790/1.2800 resistance and 200-day MA. However, bullish gains from the 1.2630 low of 9 September see support at the 1.2750/30 area expected to underpin. Only break here will ease the upside pressure and open up room for deeper pullback to the 1.2700/1.2680 area. A later break above the 1.2790/1.2800 resistance will see room for stronger gains to retrace losses from the 1.2990 June current year high and see room to the 1.2850 congestion and 61.8% Fibonacci level and 1.2875, 14 July low.