Published: 2026-09-08T06:14:13.000Z
Chart USD/TWD Update: Extending July losses
2
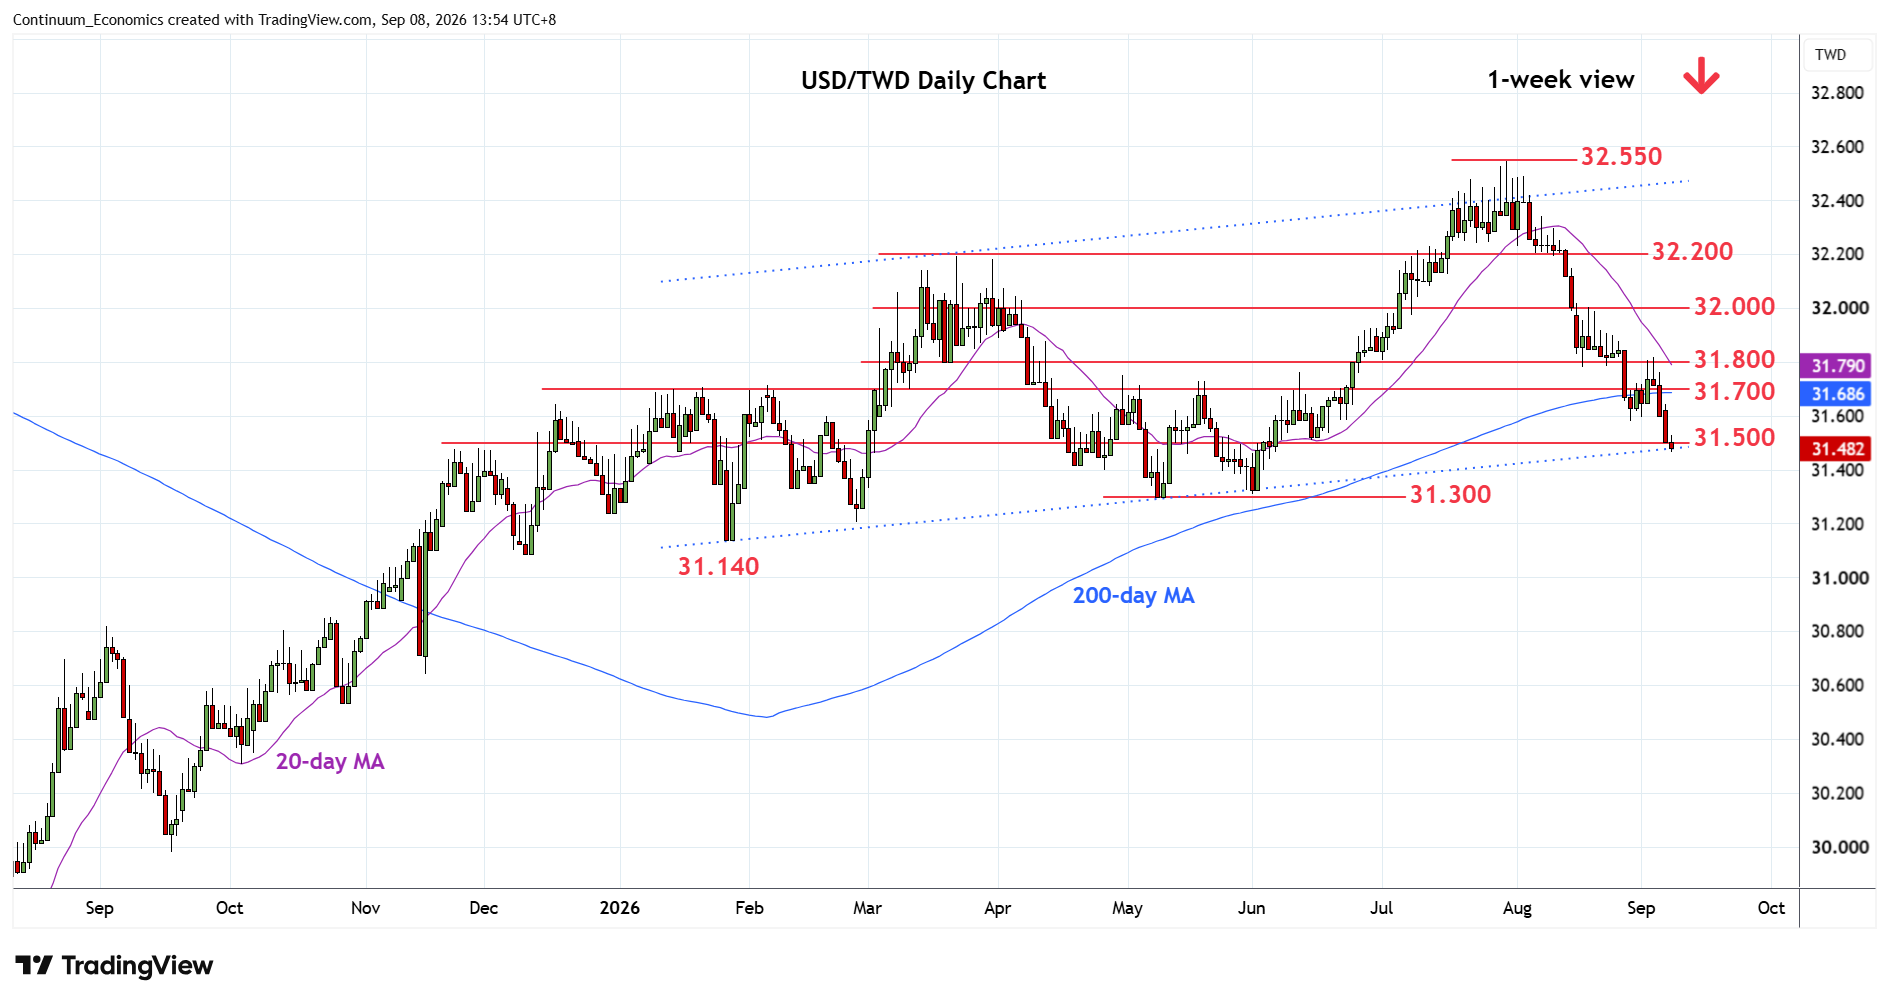
Break of the 31.600 congestive support see prices extending losses from the 32.550, July current year high
| Levels | Imp | Comment | Levels | Imp | Comment | |||
|---|---|---|---|---|---|---|---|---|
| R4 | 32.000 | * | figure, congestion | S1 | 31.400 | * | Apr low, congestion | |
| R3 | 31.780/800 | ** | 18 Aug low, congestion | S2 | 31.300 | ** | May low | |
| R2 | 31.700 | * | congestion | S3 | 31.210 | * | Feb low | |
| R1 | 31.600 | * | congestion | S4 | 31.140 | ** | 27 Jan YTD low |
06:00 GMT - Break of the 31.600 congestive support see prices extending losses from the 32.550, July current year high. Negative daily and weekly studies keep pressure on the downside and break of the 31.500 support see room to support at 31.400 next. Lower still, will turn focus to the 31.300 May low. Would expect reaction at the latter to unwind oversold daily studies but any bounce should prove limited with resistance starting at 31.600 congestion. Above here will open up room for stronger bounce to strong resistance at the 31.700/31.800 congestion area.