Published: 2026-08-05T04:58:12.000Z
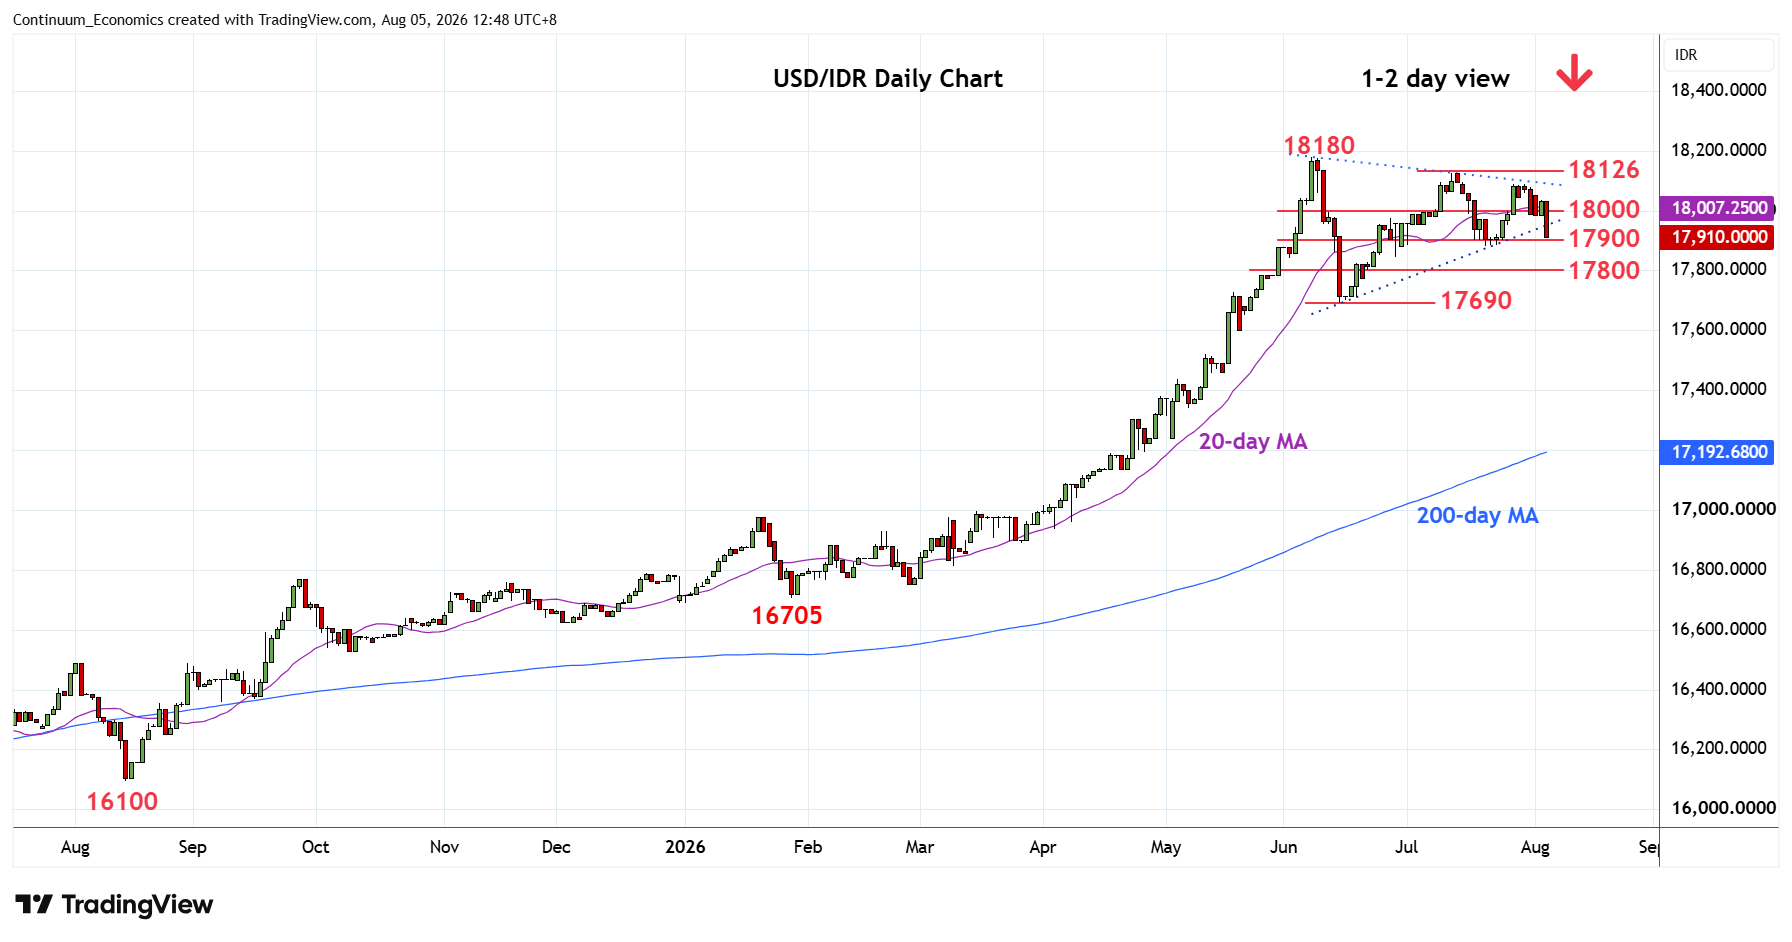
Chart USD/IDR Updates: Breakdown from triangle support
3
Consolidation at the 18000 level has given way to break lower to extend pullback from the 18090 high of 28 July
| Levels | Imp | Comment | Levels | Imp | Comment | |||
|---|---|---|---|---|---|---|---|---|
| R4 | 18180 | ** | 8 Jun all-time high | S1 | 17880 | ** | 21 Jul low | |
| R3 | 18126 | ** | 13 Jun high | S2 | 17845 | * | 29 Jun low | |
| R2 | 18090 | * | 28 Jul high | S3 | 17800 | * | congestion | |
| R1 | 18000 | * | congestion | S4 | 17690 | ** | Jun low |
Asterisk denotes strength of level
04:50 GMT - Consolidation at the 18000 level has given way to break lower to extend pullback from the 18090 high of 28 July. Break of the triangle support see pressure returning to the 17900/17880 lows. Below this will turn focus lower to the 17800 support then the 17690, June low. Would expect reaction at the latter but a later break will extend the broader losses from the 18180 all-time high. Meanwhile, resistance at the 18000 level now expected to cap and sustain losses from the 18090 and 18126 lower highs.