Published: 2026-11-13T02:33:50.000Z
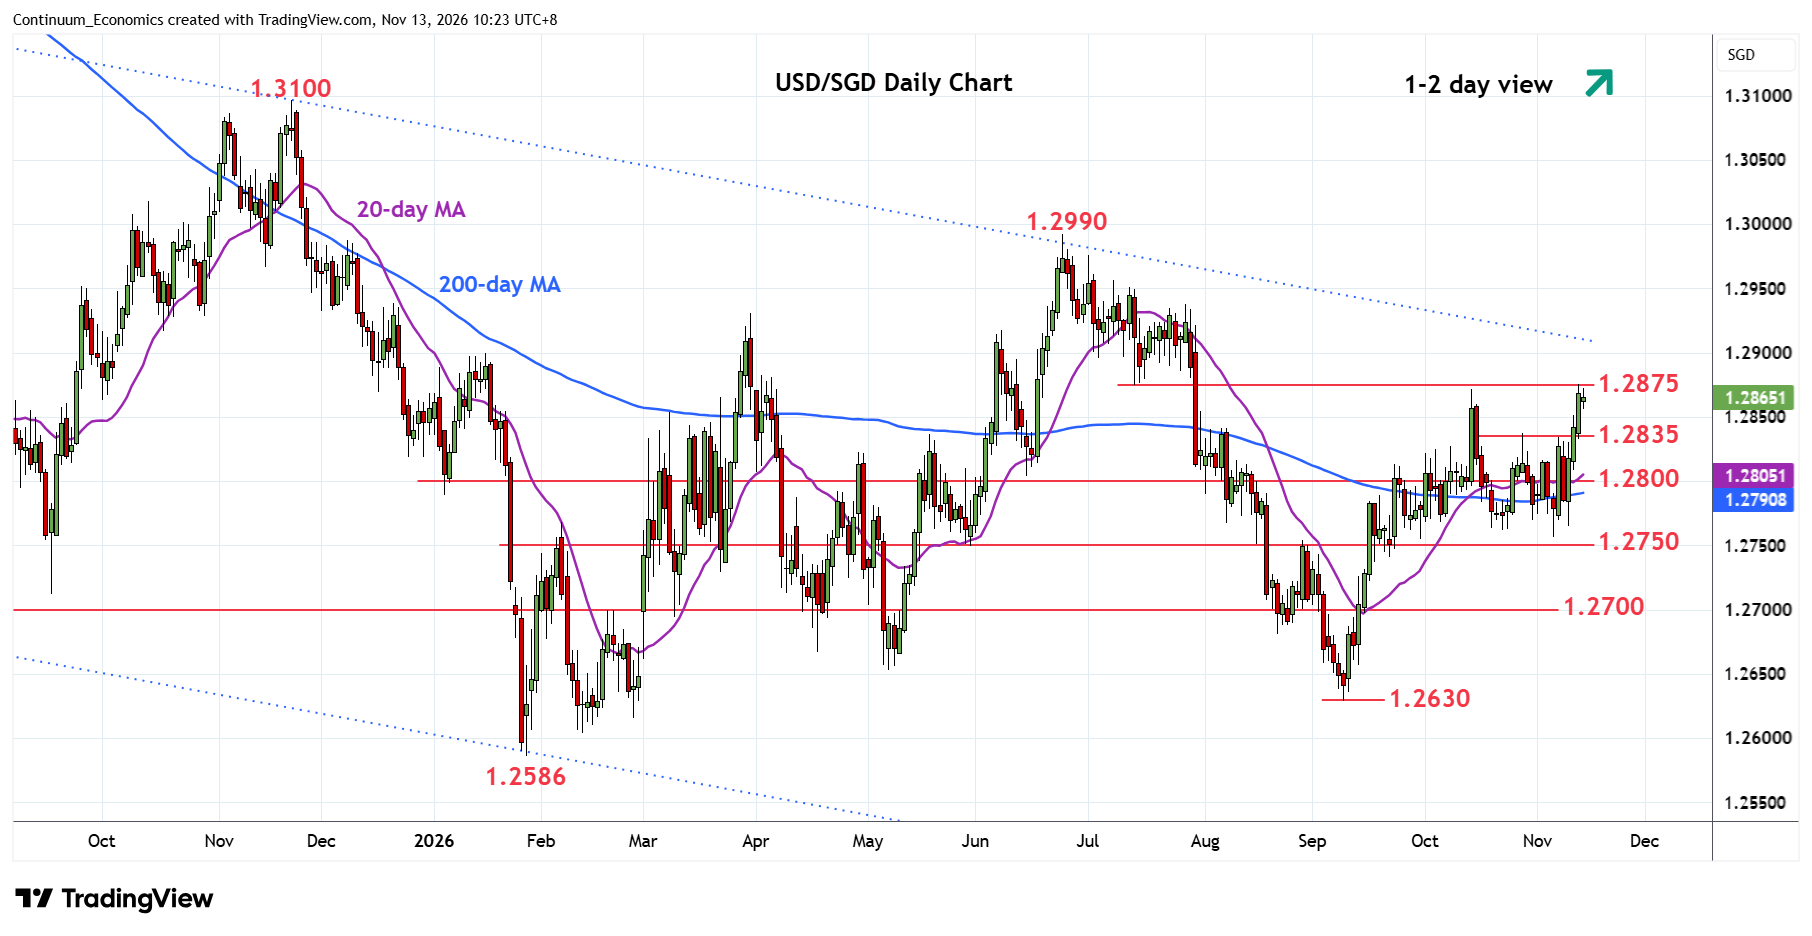
Chart USD/SGD Update: Reached strong resistance at 1.2875
1
Break above 1.2850 congestion has seen push higher to reach strong resistance at the 1.2875 low of 14 July
| Level | Comment | Level | Comment | ||||
|---|---|---|---|---|---|---|---|
| R4 | 1.2990 | ** | 24 Jun YTD high | S1 | 1.2835/00 | * | congestion |
| R3 | 1.2950 | * | congestion | S2 | 1.2762/50 | ** | 22 Oct low, congestion |
| R2 | 1.2900/10 | ** | congestion, channel | S3 | 1.2700 | * | congestion, 2025 yr low |
| R1 | 1.2875 | ** | 14 Jul low | S4 | 1.2680 | * | Aug low |
Asterisk denotes strength of level
02:30 GMT - Break above 1.2850 congestion has seen push higher to reach strong resistance at the 1.2875 low of 14 July. Daily studies are stretched but further gains cannot be ruled out to extend bullish momentum from the 1.2762/50 support. Clearance will see scope to the 1.2900/10 congestion and channel resistance from November 2025 high. Meanwhile, support is raised to the 1.2835/00 congestion area which should underpin. Would take break here to ease the upside pressure and see deeper pullback to retest the 1.2762/50 support area.