Published: 2026-06-10T04:43:45.000Z
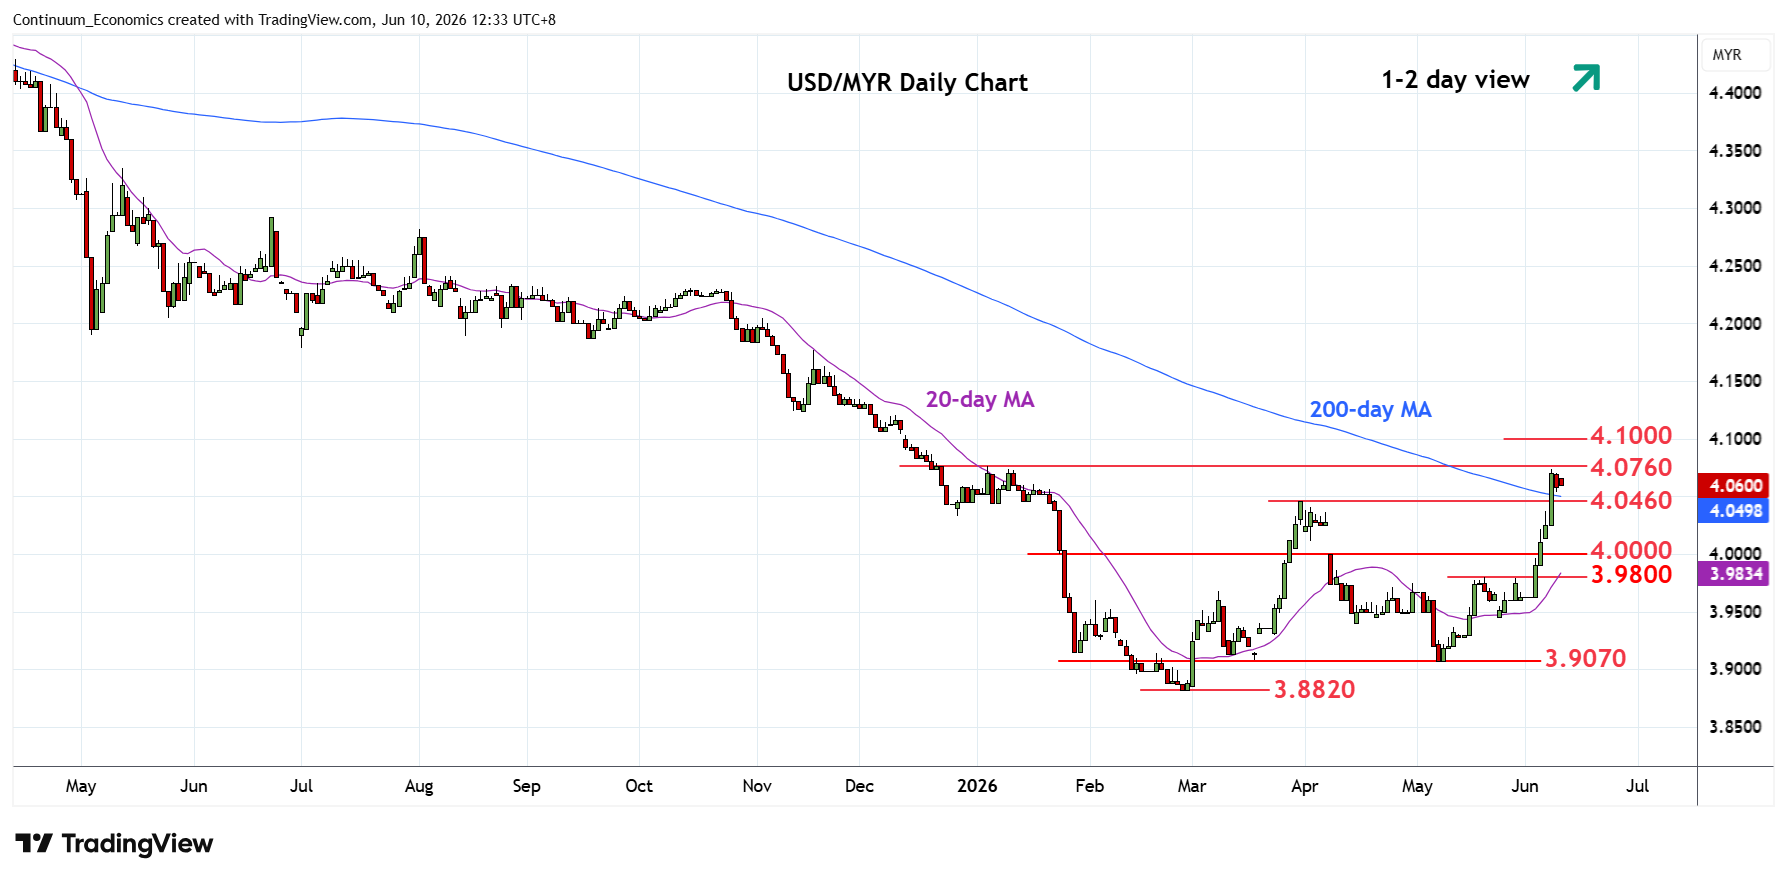
Chart USD/MYR Update: Consolidating below 4.0760, January YTD high
1
Settled back in consolidation beneath strong resistance at 4.0760, 5 January YTD high
| Levels | Imp | Comment | Levels | Imp | Comment | |||
|---|---|---|---|---|---|---|---|---|
| R4 | 4.1240 | ** | Nov 2025 low, 38.2% | S1 | 4.0460 | * | Mar high | |
| R3 | 4.1200 | * | congestion | S2 | 4.0250 | 8 Jun low | ||
| R2 | 4.1000 | ** | figure, 2024 yr low | S3 | 4.0000 | * | figure | |
| R1 | 4.0760 | ** | 5 Jan YTD high | S4 | 3.9800 | ** | May high |
Asterisk denotes strength of level
04:40 GMT - Settled back in consolidation beneath strong resistance at 4.0760, 5 January YTD high. Consolidation see prices unwinding overbought intraday and daily studies and suggest room for deeper pullback to correct recent strong gains from the 3.9500 level. Break of 4.0460 support will open up room for deeper pullback to the 4.0250/4.0000 area. Meanwhile, resistance at 4.0760 January high is expected to cap. Clearance here will extend the broader gains from the February low to retrace losses from the January 2025 year high.