Published: 2026-11-12T04:44:28.000Z
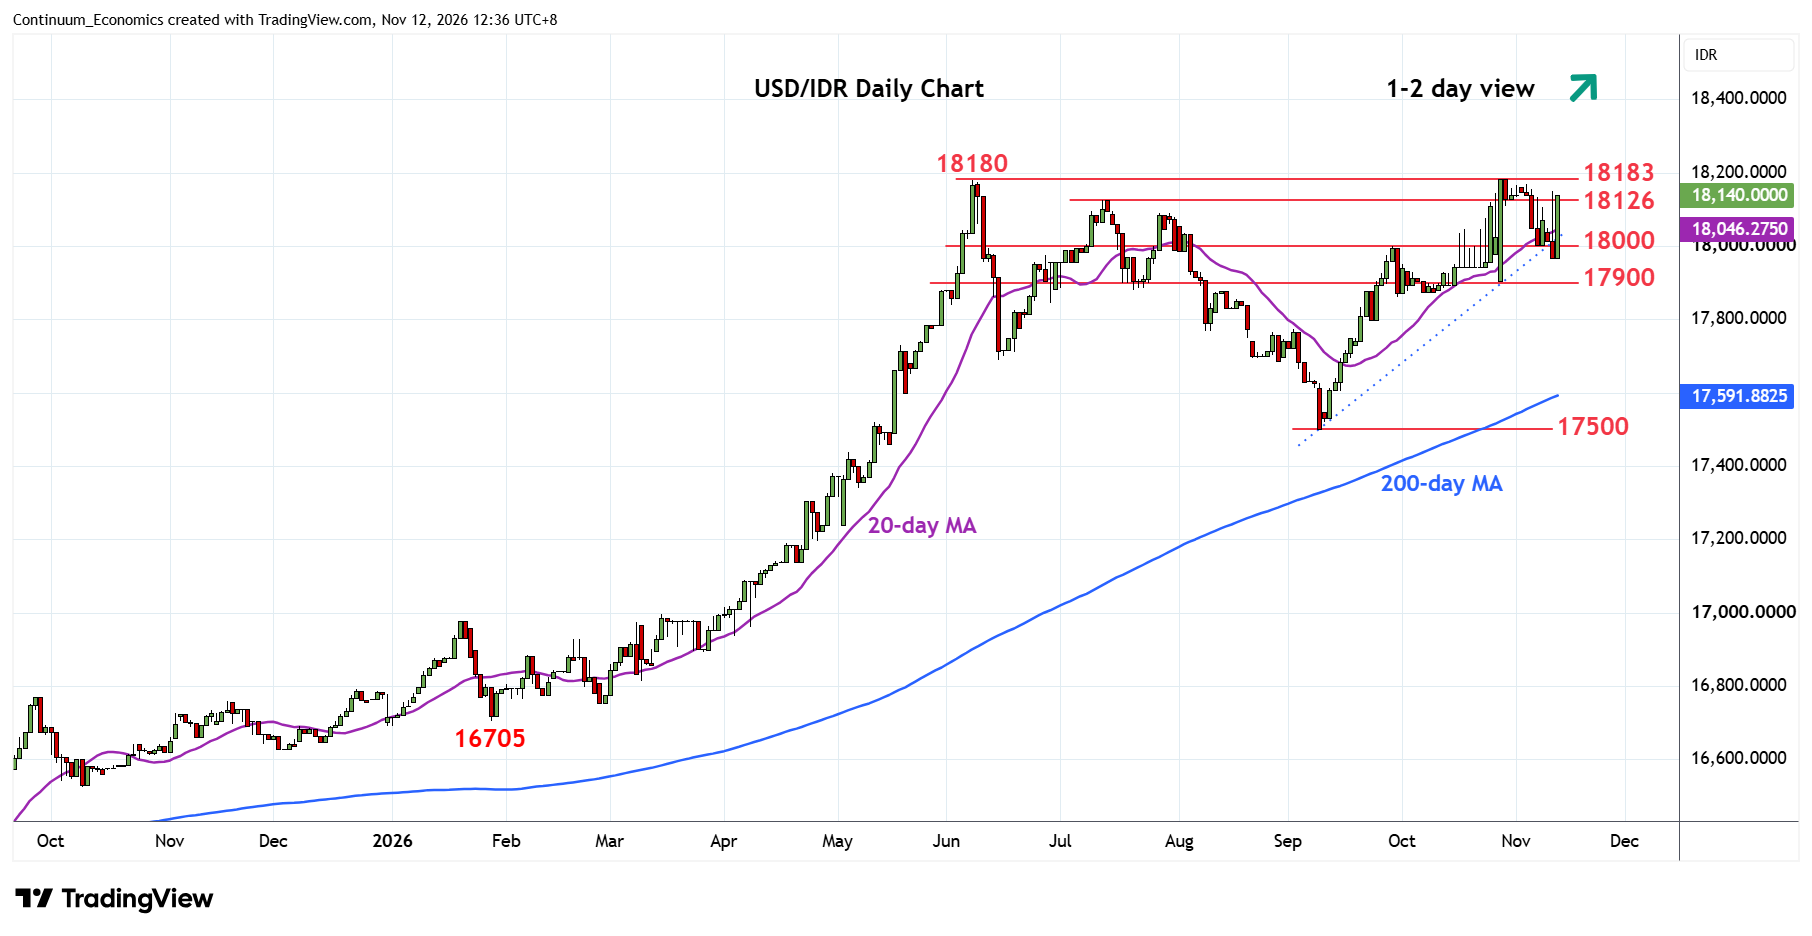
Chart USD/IDR Updates: Poised for retest of 18183 historic high
1
Higher in choppy trade and bounce from the 17970 low see prices back to pressure the upside
| Levels | Imp | Comment | Levels | Imp | Comment | |||
|---|---|---|---|---|---|---|---|---|
| R4 | 18800 | projection | S1 | 17970 | * | 11 Nov low | ||
| R3 | 18500 | figure | S2 | 17900 | ** | congestion | ||
| R2 | 18300 | projection | S3 | 17860 | * | 30 Sep low | ||
| R1 | 18183 | ** | 28 Oct all-time high | S4 | 17770 | * | 10 Aug low |
Asterisk denotes strength of level
04:40 GMT - Higher in choppy trade and bounce from the 17970 low see prices back to pressure the upside. Above the 18090/18126 July high return focus to the 18180/18183, June and October historic high. Clearance here will extend the underlying bull trend and see room to Fibonacci extension targets at 18300 and the 18500/18550 area. Meanwhile, support at the 18000 and extending to 17970 low should underpin. Would take break here to fade the upside pressure and see pullback to retrace strong gains from the 17500 Spetember low to the 17900/17860, October/late-September lows.