Published: 2026-06-26T02:27:44.000Z
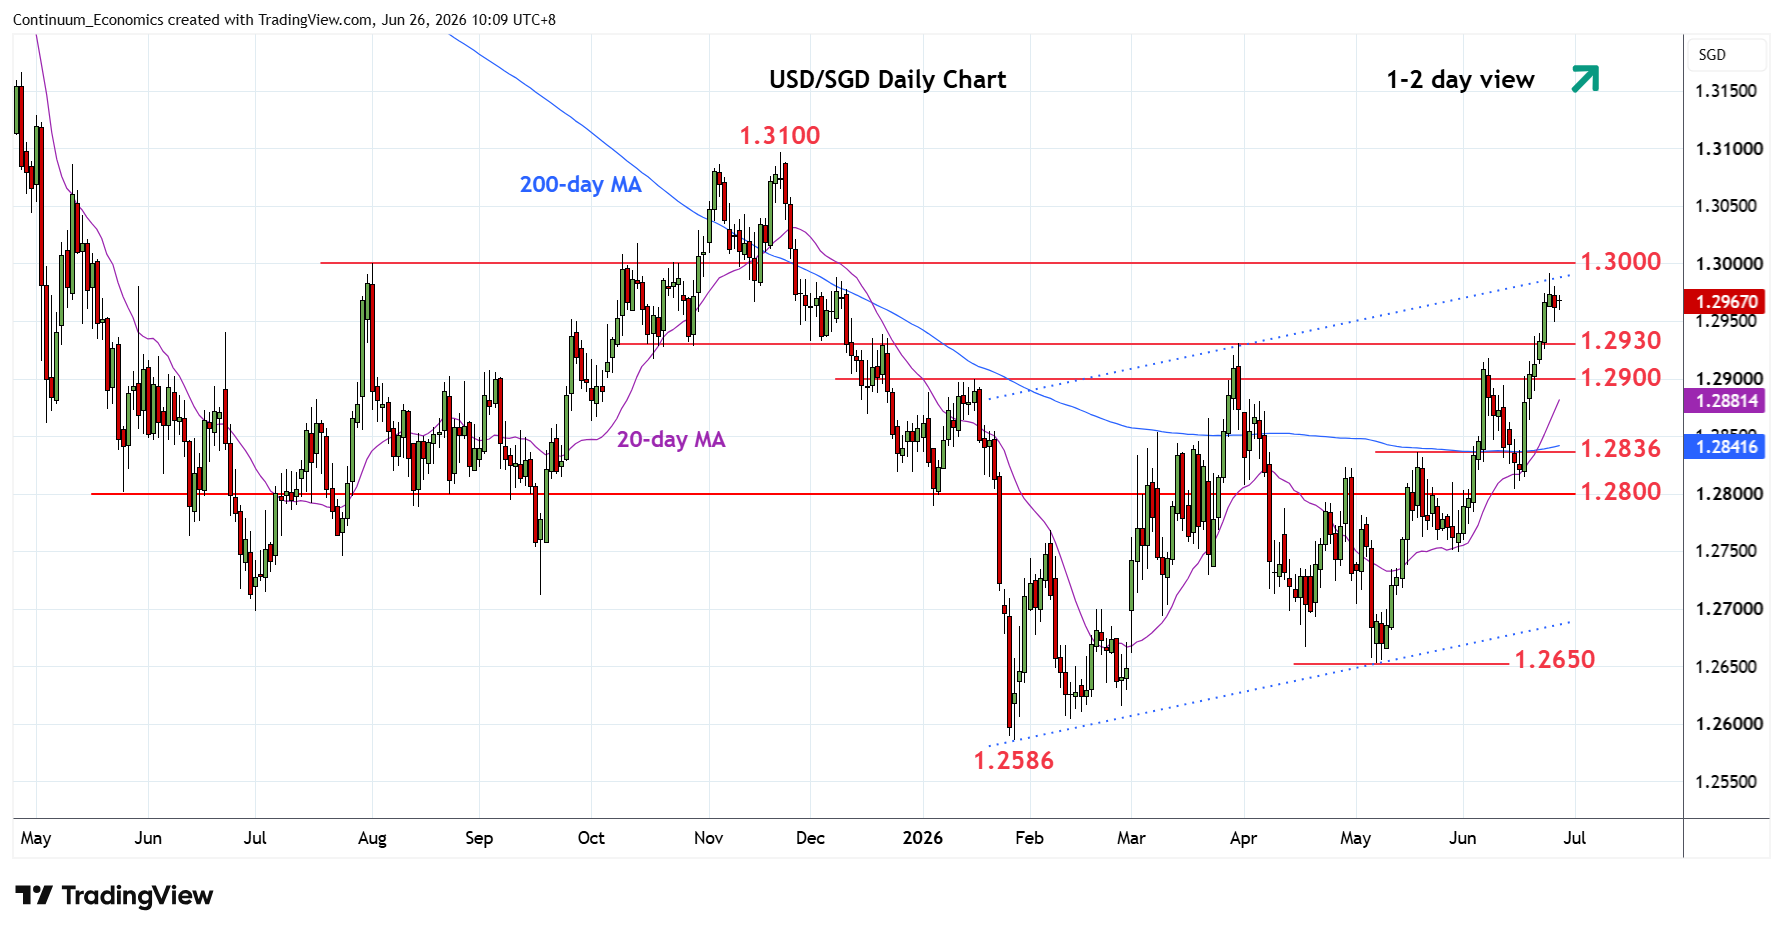
Chart USD/SGD Update: Consolidating test of 1.2985 resistance
-
Settled back from test of the 1.2985 December high and channel resistance from the January low
| Level | Comment | Level | Comment | ||||
|---|---|---|---|---|---|---|---|
| R4 | 1.3100 | ** | Nov high | S1 | 1.2930 | * | Mar high |
| R3 | 1.3050 | * | congestion | S2 | 1.2900 | * | congestion |
| R2 | 1.3000 | ** | figure, congestion | S3 | 1.2850/36 | ** | congestion, May high |
| R1 | 1.2985 | ** | Dec high, channel | S4 | 1.2805/00 | ** | 15 Jun low, congestion |
Asterisk denotes strength of level
02:20 GMT - Settled back from test of the 1.2985 December high and channel resistance from the January low. However, a later break here cannot be ruled out but overbought daily studies suggest scope for pullback to consolidate strong gains from the 1.2800 low of last week to support at the 1.2930/1.2900 area which should underpin. Break here will ease the upside pressure and see room to strong support at the 1.2850/36 congestion and May high. Meanwhile, break above 1.2985 high will open up room for extension to 1.3000/50 congestion.