Continuum Economics
  • Search
  • About Us
  • Buy
  • Invite A Friend
  • My Basket
  • Articles
  • Calendar
  • Forecasts
  • Events
  • Data
  • Newsletters
  • My Alerts
  • Community
  • Directory
  • About Us
  • Buy
  • Invite A Friend
  • My Basket
  • Articles
    • All
    • Thematic
    • Tactical
    • Asia
    • EMEA
    • Americas
    • Newsletters
    • Freemium
    • Editor's Choice
    • Most Viewed
    • Most Shared
    • Most Liked
  • Calendar
    • Interactive
      • China
      • United States
      • Eurozone
      • United Kingdom
    • Month Ahead
    • Reviews
    • Previews
  • Forecasts
    • Forecasts
    • Key Views
  • Events
    • Media
    • Webinars
  • Data
    • Country Insights
    • Shadow Credit Ratings
    • Full CI Data Download
  • Newsletters
  • My Alerts
  • Community
    • FX
    • Fixed Income
    • Macro Strategy
    • Credit Markets
    • Equities
    • Commodities
    • Precious Metals
    • Renewables
  • Directory
  • My Account
  • Notifications Setup
  • Administration Panel
  • Account Details
  • Recent Devices
  • Distribution Lists
  • Shared Free Trials
  • Saved Articles
  • Shared Alerts
  • My Posts
Back
Published: 2026-05-18T06:26:46.000Z

Chart USD/IDR Updates: Extend parabolic gains

3

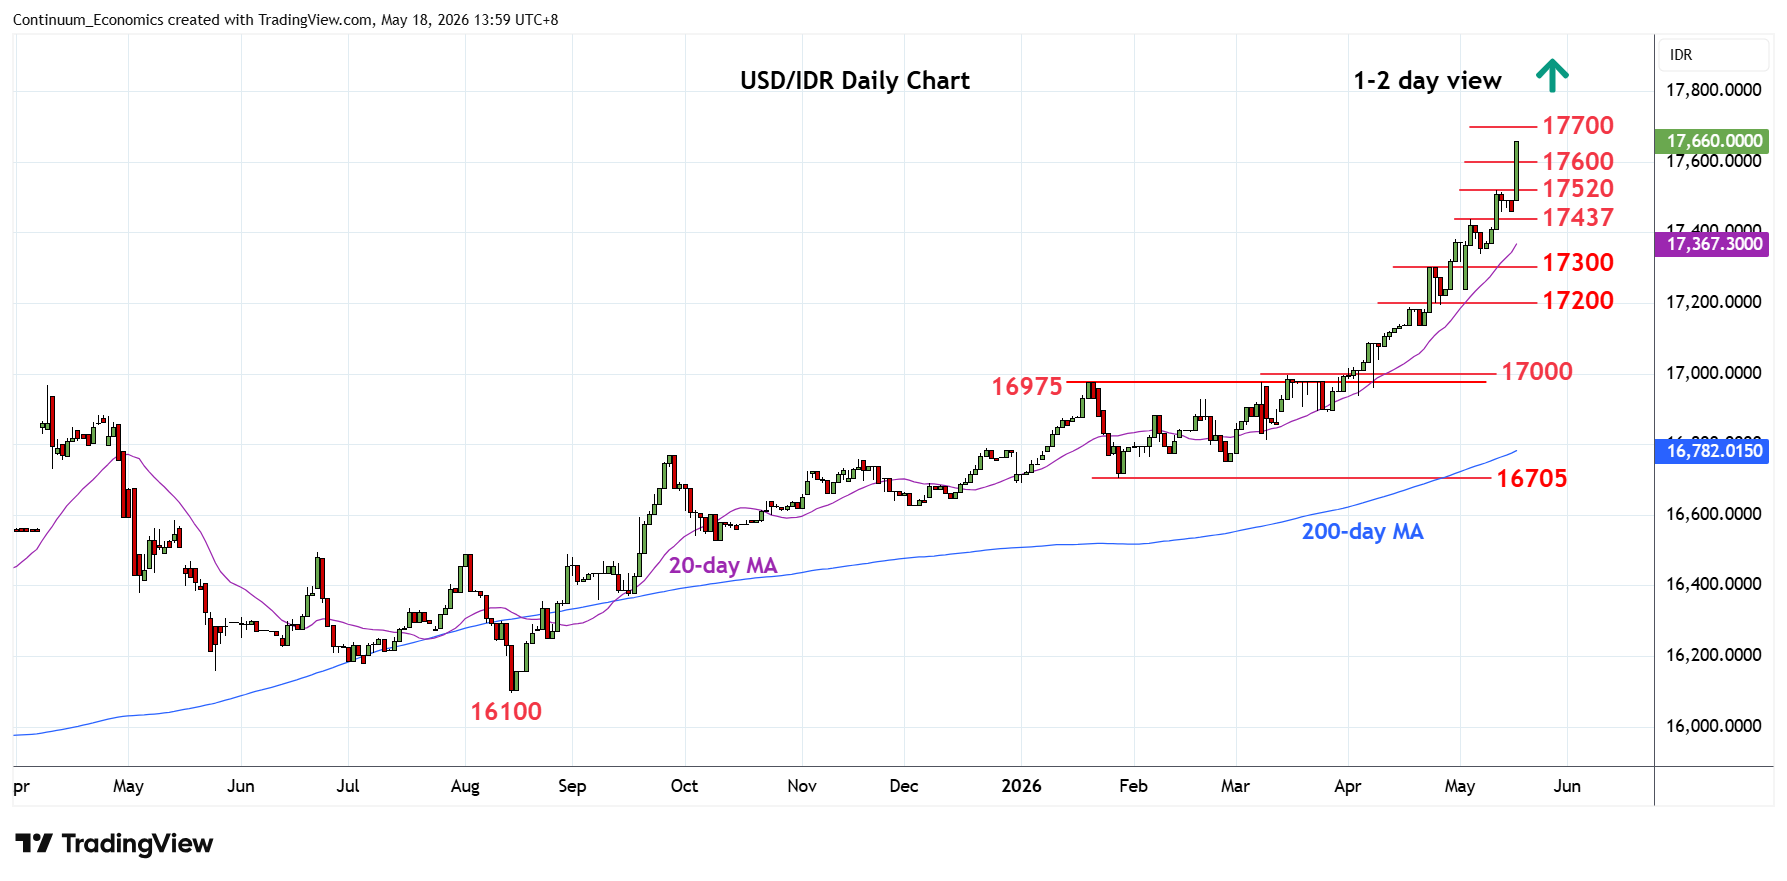
Consolidation below the 17520 high has given way to break to reach fresh historic high at 17660

 LevelsImpComment  LevelsImpComment
R418000 figure S117520*12 May high
R317800 projection S217437*5 May high
R217700 projection S317300*23 Apr high
R117660 intraday high S417240/200**4 May low, congestion

Asterisk denotes strength of level

06:15 GMT - Consolidation below the 17520 high has given way to break to extend parabolic gains from the 16705 January low to reach 17660 historic high. Bullish structure keep pressure on the upside and see room for further gains to 17700 and 17800 projection targets and 18000 figure. However, overbought daily and weekly studies caution corrective pullback with support now raised to the 17520 high of last week. Would take pullback below this will ease the upside pressure and see corrective pullback to support at the 17437 and 17300 previous highs.

Continue to read the article for free
Login

or

or

Topics
USD/IDR-TA
EM-Technical
Technical Analysis

GENERAL

  • Home
  • About Us
  • Our Team
  • Careers

LEGAL

  • Terms and Conditions
  • Privacy Policy
  • Compliance
  • GDPR

GET IN TOUCH

  • Contact Us
Continuum Economics
The Technical Analyst Awards Winner 2021
The Technical Analyst Awards Finalist 2020

© 2026 Continuum Economics

image