Published: 2026-09-04T02:33:11.000Z
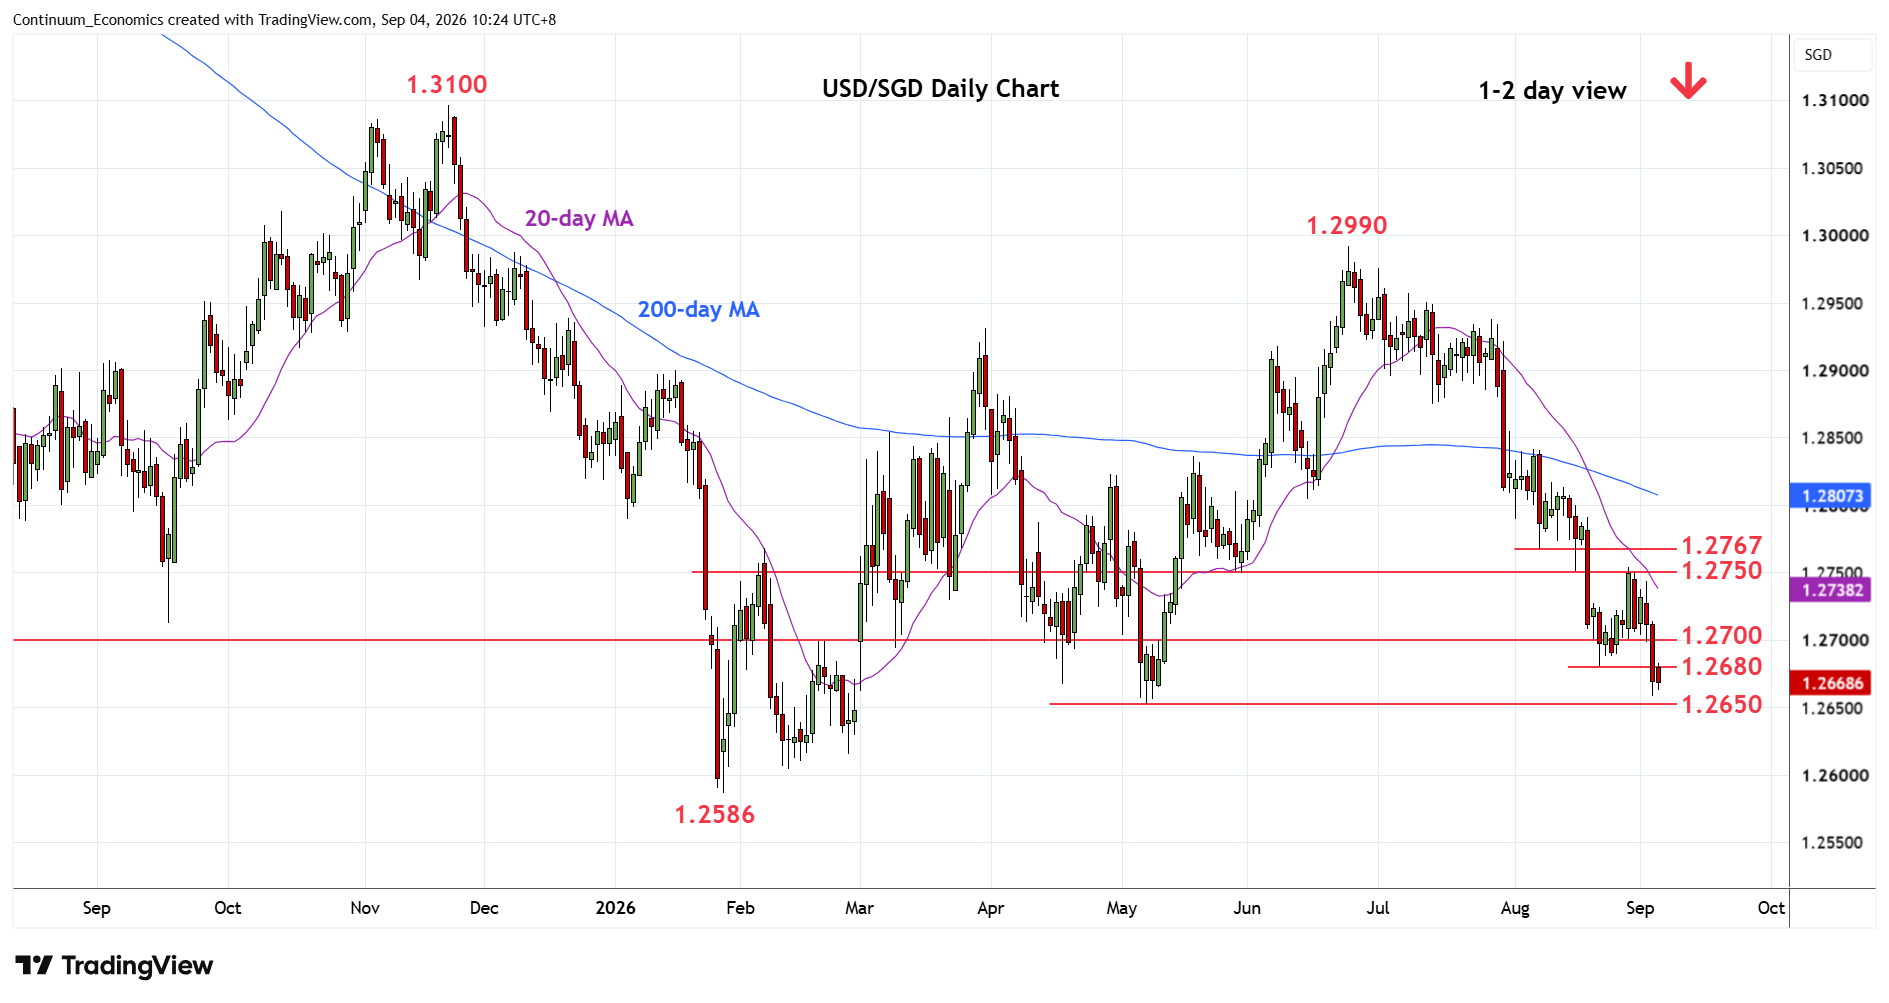
Chart USD/SGD Update: Under pressure, 1.2650 May low at risk
1
Break of the 1.2700 level has seen follow-through below the 1.2680 August low to approach support at 1.2650, May low
| Level | Comment | Level | Comment | ||||
|---|---|---|---|---|---|---|---|
| R4 | 1.2800 | * | congestion | S1 | 1.2650 | ** | May low |
| R3 | 1.2750/67 | ** | congestion, 7 Aug low | S2 | 1.2615/05 | * | 26, 12 Feb lows |
| R2 | 1.2700 | * | congestion | S3 | 1.2586 | ** | 28 Jan YTD low |
| R1 | 1.2650 | * | Aug low | S4 | 1.2550 | * | congestion from 2014 |
Asterisk denotes strength of level
02:30 GMT - Break of the 1.2700 level has seen follow-through below the 1.2680 August low to approach support at 1.2650, May low. Prices has since turned up in range from the 1.2658 low to consolidate losses from the 1.2750 high of last weekand unwind oversold intraday studies. However, pressure remains on the downside and lower will see room for extension to retest the 1.2615/05 February lows then the 1.2586, January current year low. Meanwhile, resistance is lowered to the 1.2680/1.2700 congestion area which is expected to cap.