Published: 2026-07-23T15:33:24.000Z
Chart USD/BRL Update: Consolidating losses - background studies deteriorating
1
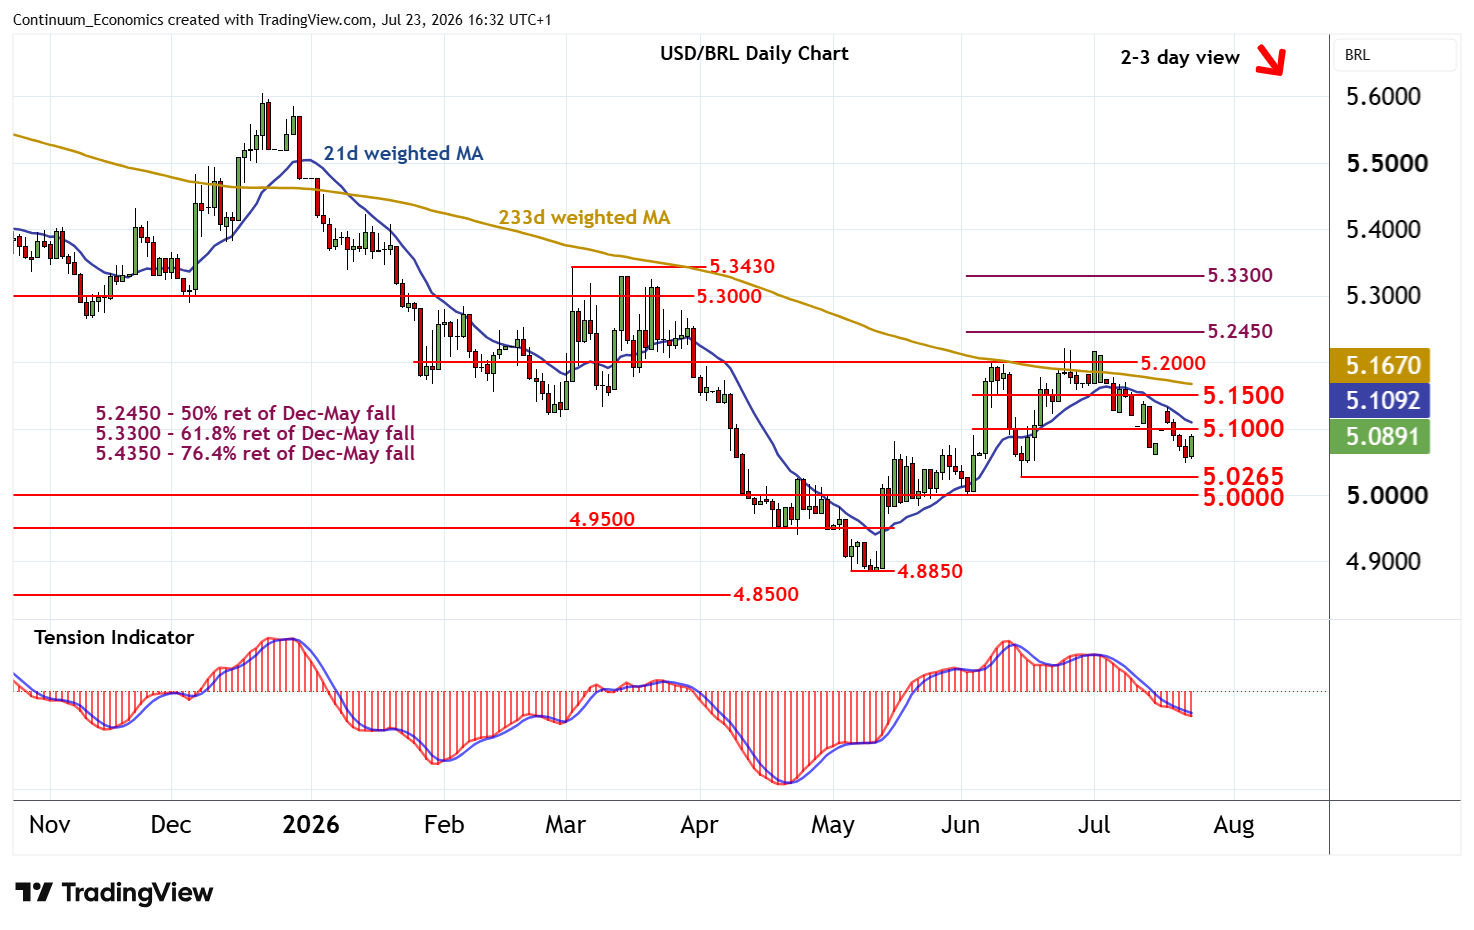
The break below 5.1000 has reached 5.0485, where flattening oversold daily stochastics are prompting short-covering and a bounce
| Levels | Imp | Comment | Levels | Imp | Comment | |||
|---|---|---|---|---|---|---|---|---|
| R4 | 5.2450 | ** | 50% ret of Dec-May fall | S1 | 5.0485 | 22 Jul low | ||
| R3 | 5.2000 | ** | congestion | S2 | 5.0265 | * | 15 Jun (w) low | |
| R2 | 5.1500 | * | break level | S3 | 5.0000 | ** | congestion | |
| R1 | 5.1000 | * | break level | S4 | 4.9500 | ** | congestion |
Asterisk denotes strength of level
16:15 BST - The break below 5.1000 has reached 5.0485, where flattening oversold daily stochastics are prompting short-covering and a bounce. Immediate focus is back on resistance at 5.1000. But the bearish daily Tension Indicator and deteriorating weekly charts should limit any break in renewed selling interest beneath 5.1500. Meanwhile, support is down to the 5.0265 weekly low of 15 JUne. A close beneath here would add weight to sentiment and extend late-June losses below congestion support at 5.0000 towards 4.9500.