2025 Q3 Country Insights Scores to Download in Excel
The Country Insights Model is a comprehensive quantitative tool for assessing country and sovereign risk by measuring a country’s risk of external and domestic financial shocks and its ability to grow. The access to our full range of scores across 174 countries corresponding to the third quarter of 2025 is now available.
The scores file allows for comparison with other periods and ranking for all countries across the headline indicators and are available as easily accessible time series.
The Country Insights model generates three composite indexes: Investment Attractiveness (IAI), Sovereign Risk (SRI), and the Country Strength (CSI). The CSI is based on four underlying pillars, namely external adjustment capacity, institutional strength, medium-term growth prospects, and social inclusion. Together, these dimensions capture a country’s macroeconomic fundamentals, growth trajectory, and socio-political resilience. Figure 1 illustrates the CSI ranking for 169 countries, where a rank of 1 represents the strongest performance and 169 the weakest.
Figure 1: Country Strengh Index Rankings
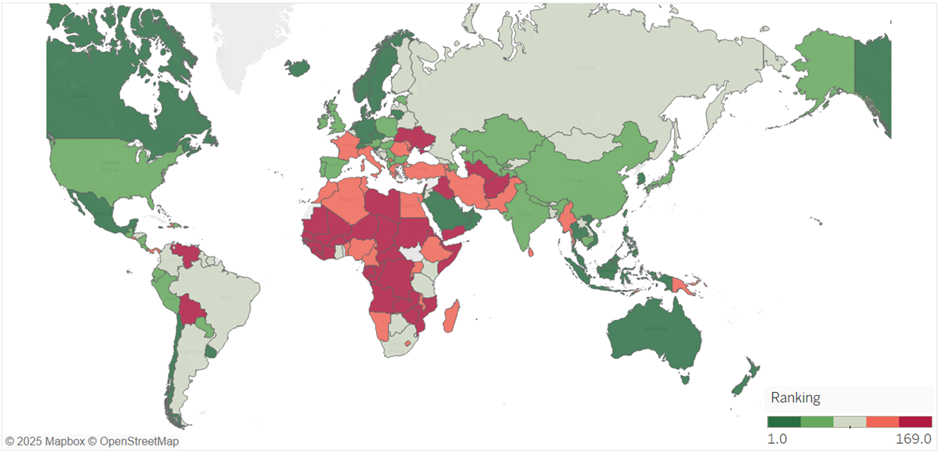
Source: Continuum Economics
The Country Strength Index reveals significant variation across countries, highlighting differences in economic resilience and governance. Macau, the United Arab Emirates, and Iceland rank first, second, and third respectively, indicating the strongest overall country strength, while Afghanistan, Guinea-Bissau, and Yemen rank among the lowest, reflecting serious structural vulnerabilities. Across the four pillars, the average scores are approximately 6.5 for external adjustment capacity, 5.9 for institutional robustness, 5.4 for medium-term growth potential, and 6.2 for social inclusion. High-ranking countries consistently score well across the first two pillars. For example, Iceland achieves a 7.1 score in both external adjustment capacity and institutional robustness, both above the respective averages, whereas Yemen scores 5.7 in external adjustment and 4.6 in institutional robustness, highlighting challenges in governance. The data suggest a strong relationship between institutional quality and the ability to adapt to external economic pressures, with well-governed countries better positioned to manage global shocks.
Medium-term growth potential and social inclusion reveal additional insights. Some countries such as China, India, and Brazil show moderate to high growth potential with scores of 5.9, 6.5, and 5.4 respectively, but social inclusion is more uneven, scoring 7.0, 6.2, and 5.7. This suggests that economic expansion does not always translate into broad societal benefits. Conversely, smaller or high-income nations such as Malaysia and Singapore combine solid growth potential, scoring around 7.4 and 6.5, with high social inclusion scores of 7.3 and 8.6, demonstrating that inclusive policies can coexist with economic strength. These patterns emphasize that sustainable development requires not only economic growth but also social equity, and the disparities across countries underscore ongoing global development challenges.
See Article Resources (below) to access the full range of scores.