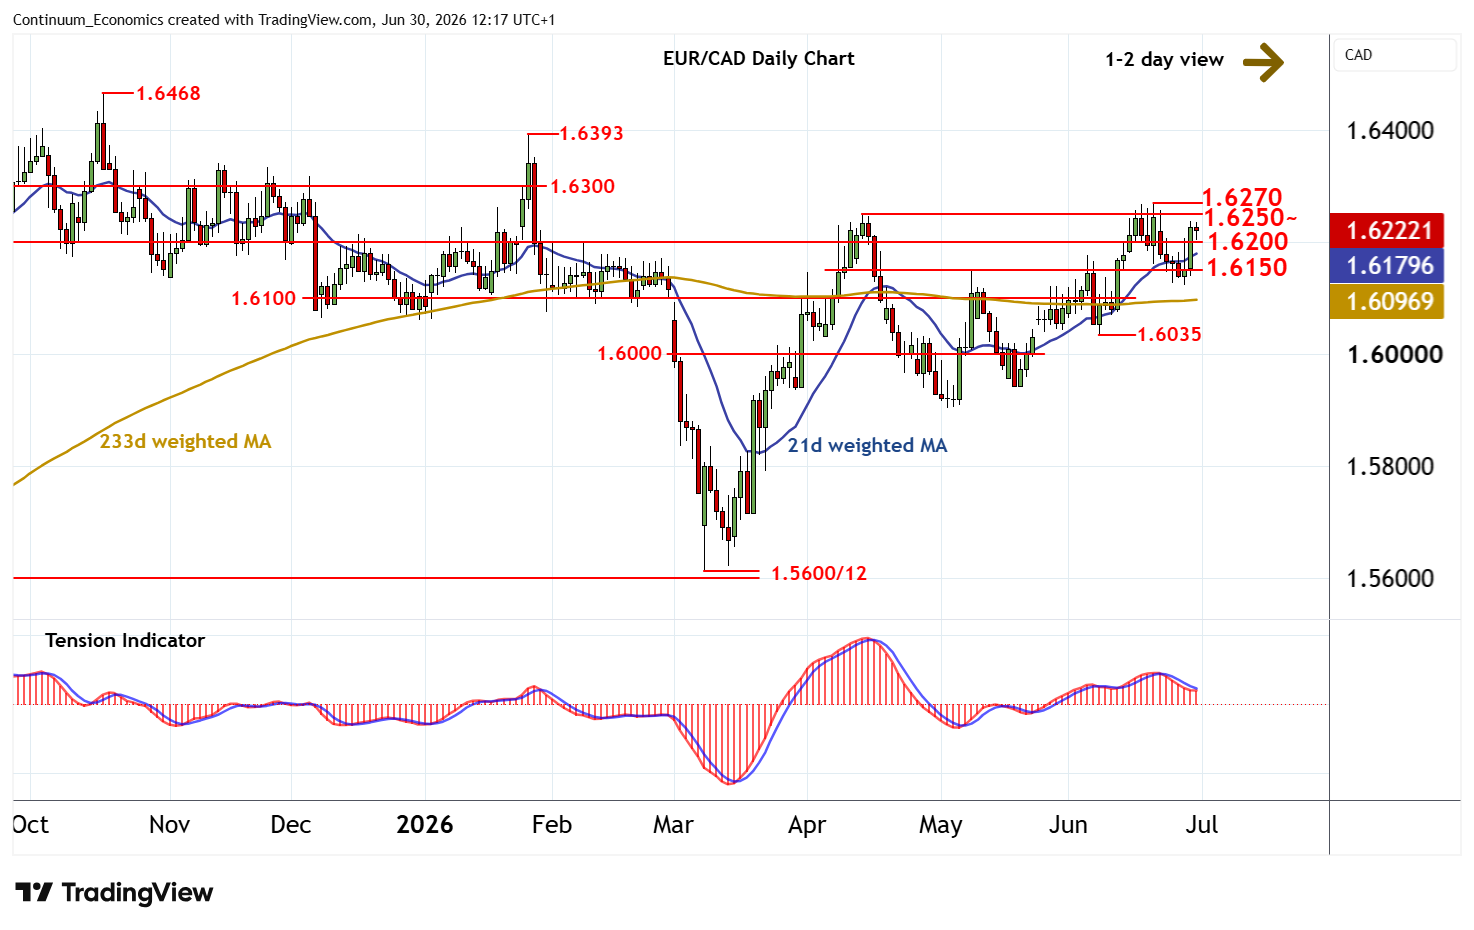
Chart EUR/CAD Update: Strong resistance at 1.6250/70
Anticipated gains have extended beyond 1.6200
| Level | Comment | Level | Comment | |||||
|---|---|---|---|---|---|---|---|---|
| R4 | 1.6393 | ** | 27 Jan YTD high | S1 | 1.6200 | ** | congestion | |
| R3 | 1.6300 | ** | congestion | S2 | 1.6150 | * | break level | |
| R2 | 1.6270 | ** | 19 Jun (m) high | S3 | 1.6100 | ** | break level | |
| R1 | 1.6250~ | ** | 14 Apr (m) high | S4 | 1.6050 | congestion |
Asterisk denotes strength
11:25 BST - Anticipated gains have extended beyond 1.6200, with prices reaching 1.6235~ before settling into consolidation above 1.6200. Oversold daily stochastics are unwinding and the bearish daily Tension Indicator is flattening, suggesting room for continuation towards stronger resistance at the 1.6250~ monthly high of 14 April. Just higher is the 1.6270 monthly high of 19 June. But flat overbought weekly stochastics could limit any initial tests of this range in consolidation, before the rising weekly Tension Indicator prompts a break and extends March gains towards 1.6300. Meanwhile, any fresh tests below 1.6200 should be limited in renewed buying interest/consolidation above 1.6150.