Published: 2026-06-24T02:51:33.000Z
Chart USD/THB Update: Extending bullish breakout
1
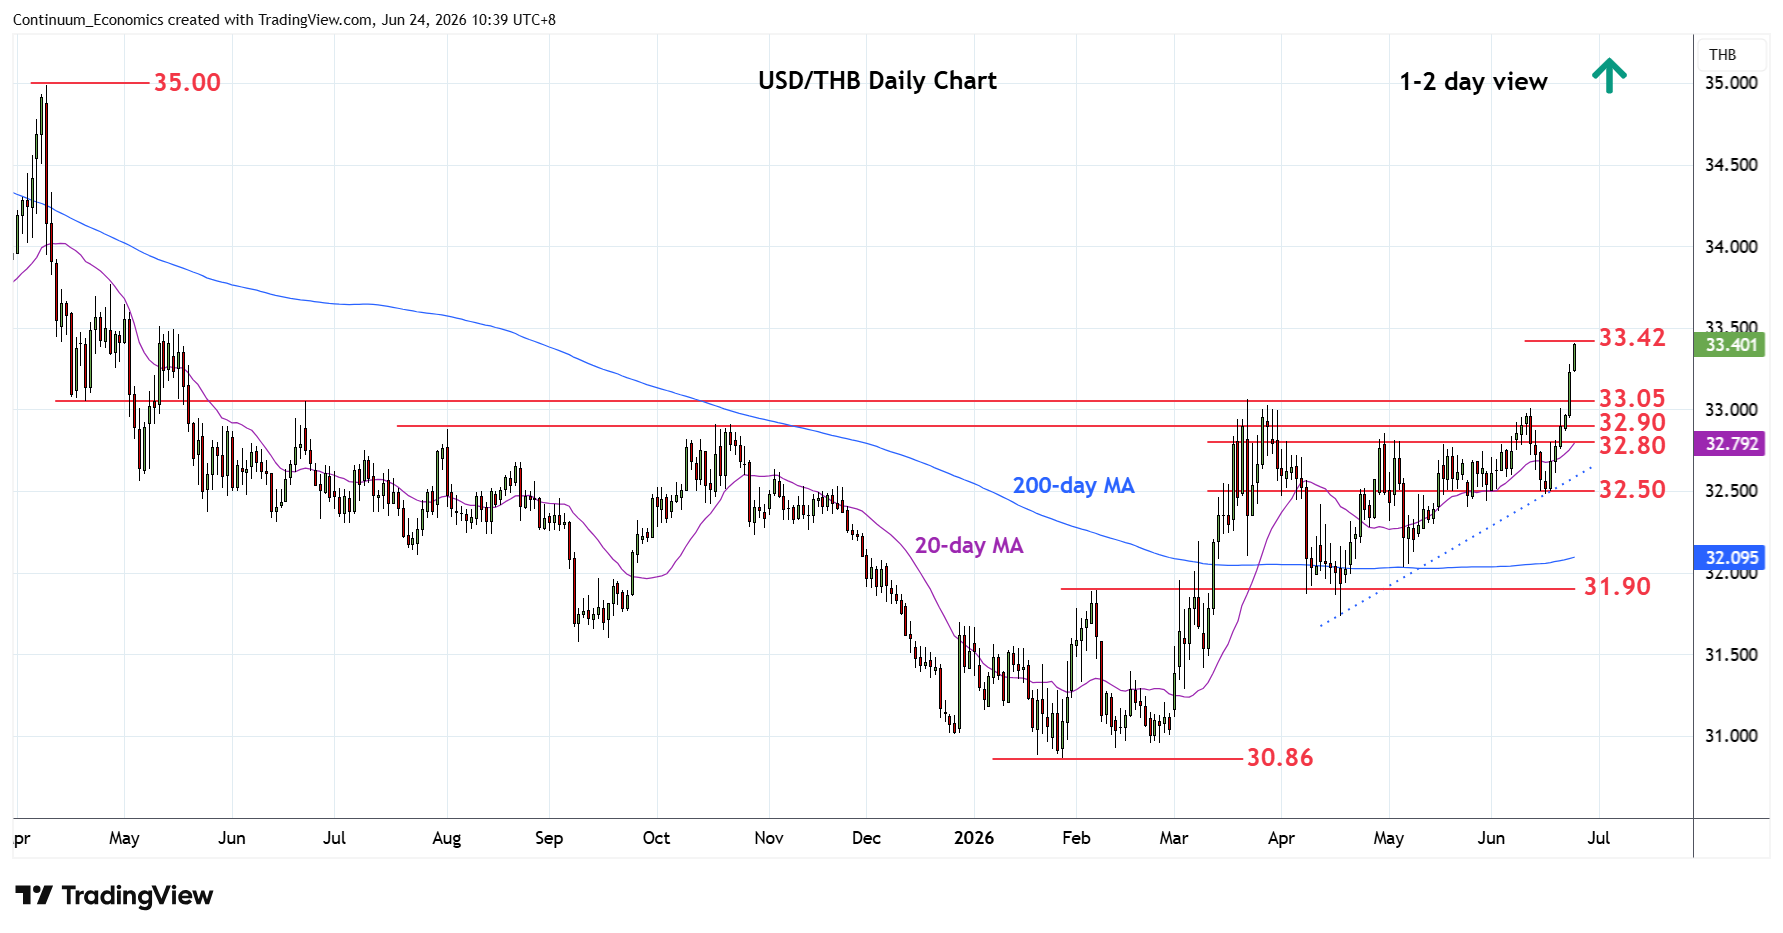
Extending sharp break of the 33.05 March high to reach fresh year high at the 33.42, 61.8% Fibonacci retracement
| Level | Comment | Level | Comment | |||||
|---|---|---|---|---|---|---|---|---|
| R4 | 34.00 | * | congestion, 76.4% | S1 | 33.20 | congestion | ||
| R3 | 33.77 | 28 Apr high | S2 | 33.05 | ** | Mar high | ||
| R2 | 33.50 | * | congestion | S3 | 32.90 | * | Oct high | |
| R1 | 33.42 | * | 61.8% 2025/2026 fall | S4 | 32.80 | * | congestion |
Asterisk denotes strength of level
02:45 GMT - Extending sharp break of the 33.05 March high to reach fresh year high at the 33.42, 61.8% Fibonacci retracement. Bullish breakout from the April ascending triangle and the 12-month bottom pattern suggest room for further gains going forward. Higher will see room to 33.50 congestion. However, overbought daily studies caution corrective pullback with support starting 33.20 congestion then the 33.05 March high which is expected to underpin and sustain bullish gains from the April swing low.