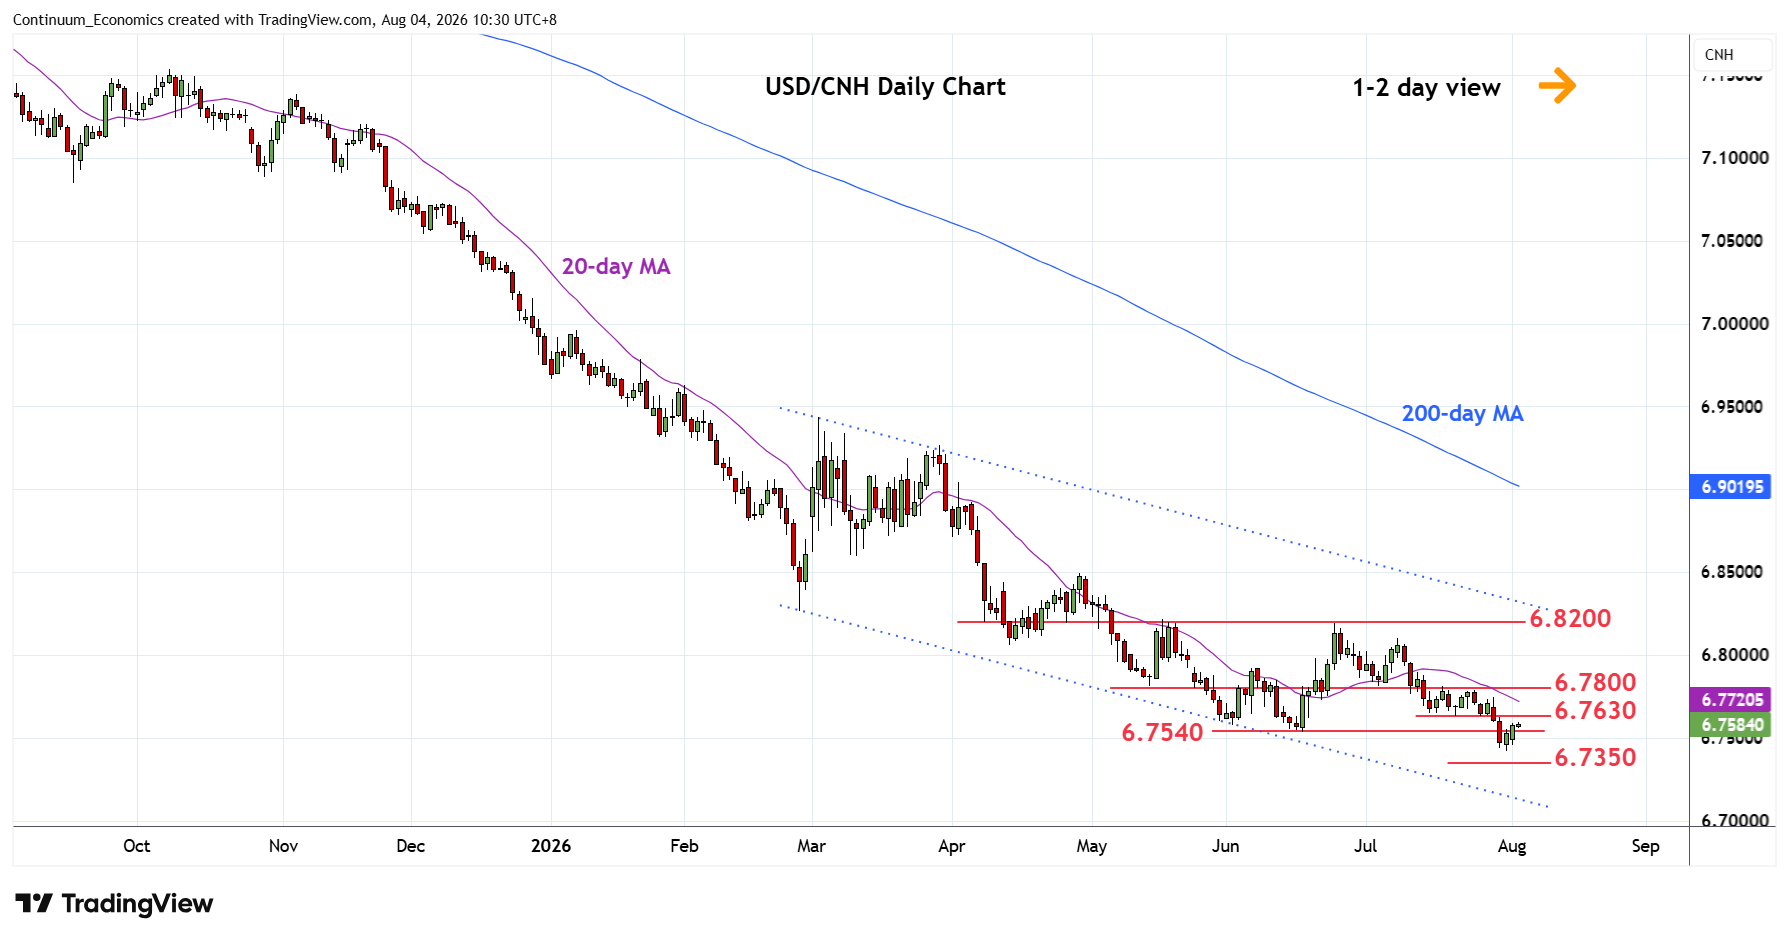
Chart USD/CNH Update: Turned up from 6.7422 current year low
Edging higher from fresh year low at 6.7422 as prices consolidate losses last week
| Level | Imp | Comment | Level | Imp | Comment | |||
|---|---|---|---|---|---|---|---|---|
| R4 | 6.8100 | * | Jul high | S1 | 6.7422 | ** | 31 Jul YTD low | |
| R3 | 6.8000 | * | congestion | S2 | 6.7350 | * | 61.8% 2022/2025 rally | |
| R2 | 6.7800 | ** | 3 Jul low | S3 | 6.7200 | * | congestion | |
| R1 | 6.7630 | * | 21 Jul low | S4 | 6.7000 | ** | 2023 year low |
Asterisk denotes strength of level
03:00 GMT - Edging higher from fresh year low at 6.7422 as prices consolidate losses last week and unwind overdold intraday and daily studies. Above the 6.7540 June low see room for stronger gains to resistance at 6.7630 low of 21 July. Regaining the latter will see room for stronger bounce to resistance at 6.7800 which is expected to cap. Clearance here, if seen, will delay bears and open up room towards strong resistance at the 6.8000/6.8200 area. However, corrective gains are expected to give way to renewed selling pressure later. Below the 6.7422 low will see room to extend the bear trend from the April 2025 year high to target support at 6.7350 Fibonacci level and the 6.7200 congestion.