Published: 2026-09-10T02:16:11.000Z
Chart USD/SGD Update: Edging lower
1
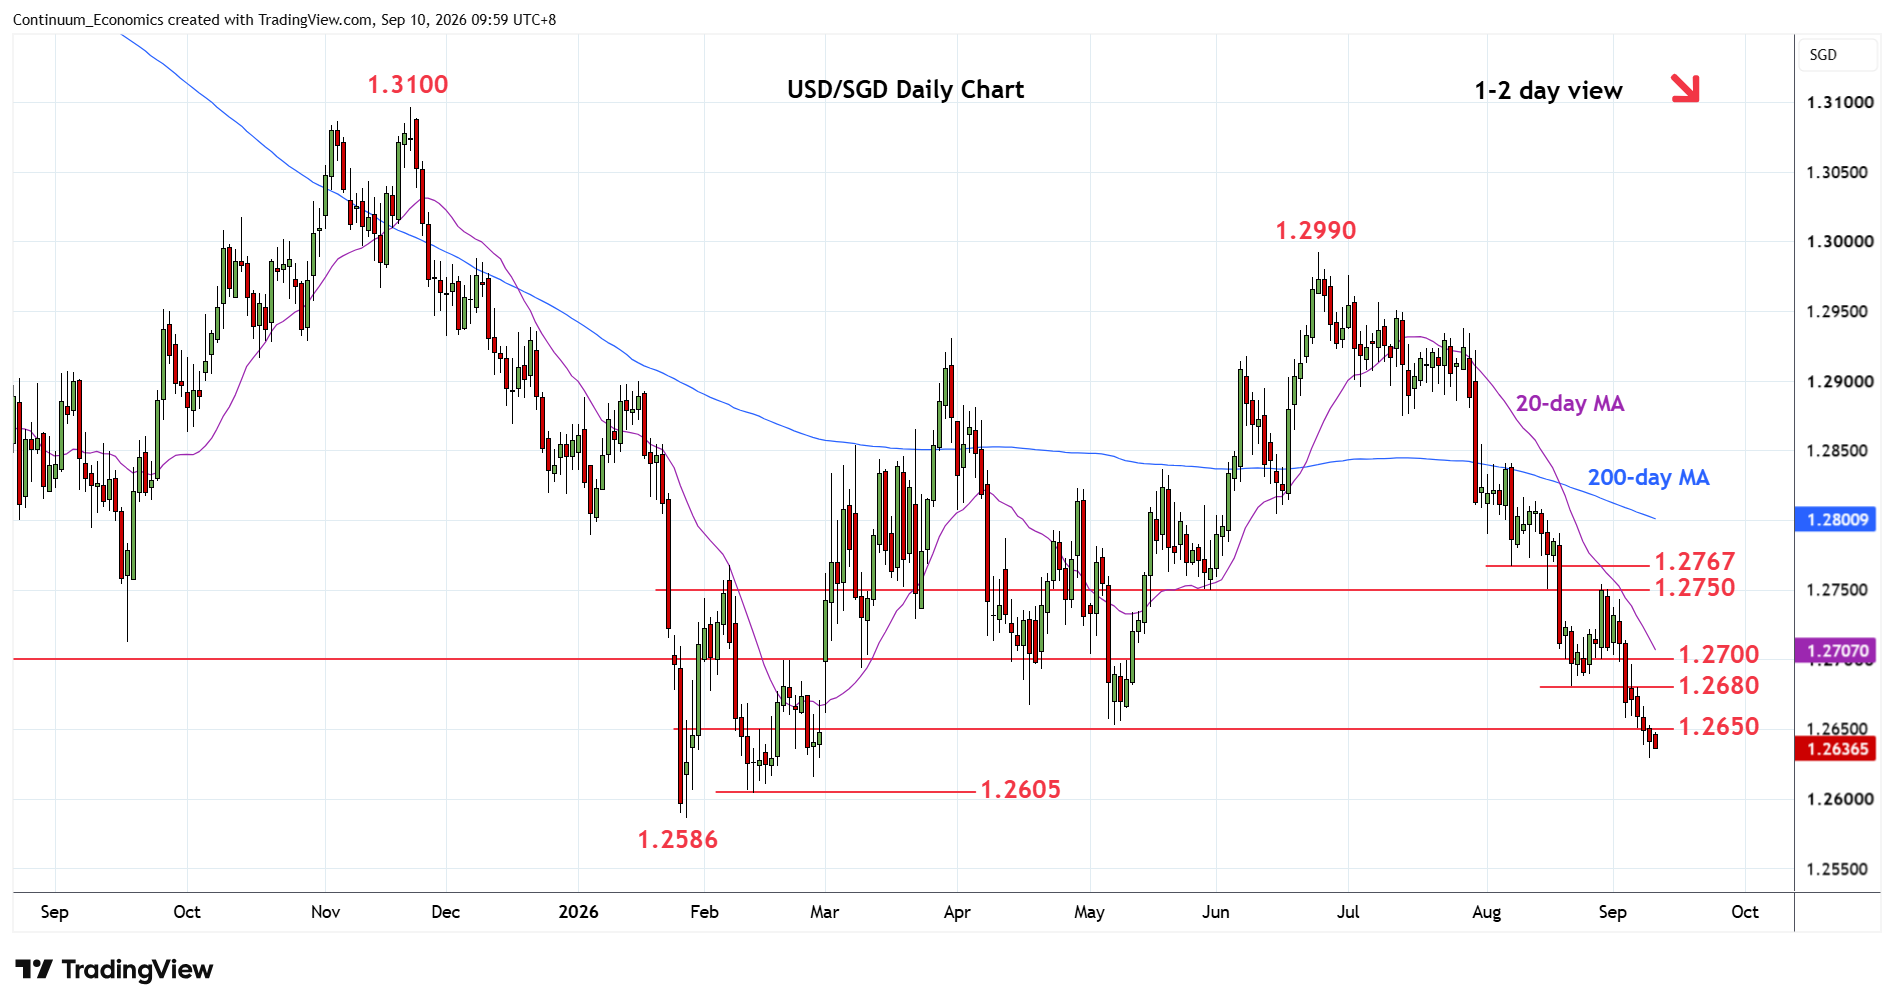
Edged off the 1.2630 low as prices consolidate losses from the 1.2750 high of last week and unwind oversold intraday studies
| Level | Comment | Level | Comment | ||||
|---|---|---|---|---|---|---|---|
| R4 | 1.2750/67 | ** | congestion, 7 Aug low | S1 | 1.2615/05 | * | 26, 12 Feb lows |
| R3 | 1.2700 | * | congestion | S2 | 1.2586 | ** | 28 Jan YTD low |
| R2 | 1.2680 | * | Aug low | S3 | 1.2550 | * | Aug 2014 high |
| R1 | 1.2652 | * | May low | S4 | 1.2500 | * | congestion |
Asterisk denotes strength of level
02:15 GMT - Edged off the 1.2630 low as prices consolidate losses from the 1.2750 high of last week and unwind oversold intraday studies. However, pressure remains on the downside and see room to nearby support at the 1.2615/05 February lows then the 1.2586, 28 January current year low. Would expected reaction at the latter as daily and weekly studies extend into oversold areas. Meanwhile, resistance is lowered to the 1.2652/1.2680, recent May and August lows, which are expected to cap corrective bounce. Only above here will see room for stronger bounce to the 1.2700/50 area.