Published: 2026-08-06T04:30:08.000Z
Chart USD/IDR Updates: Under pressure
5
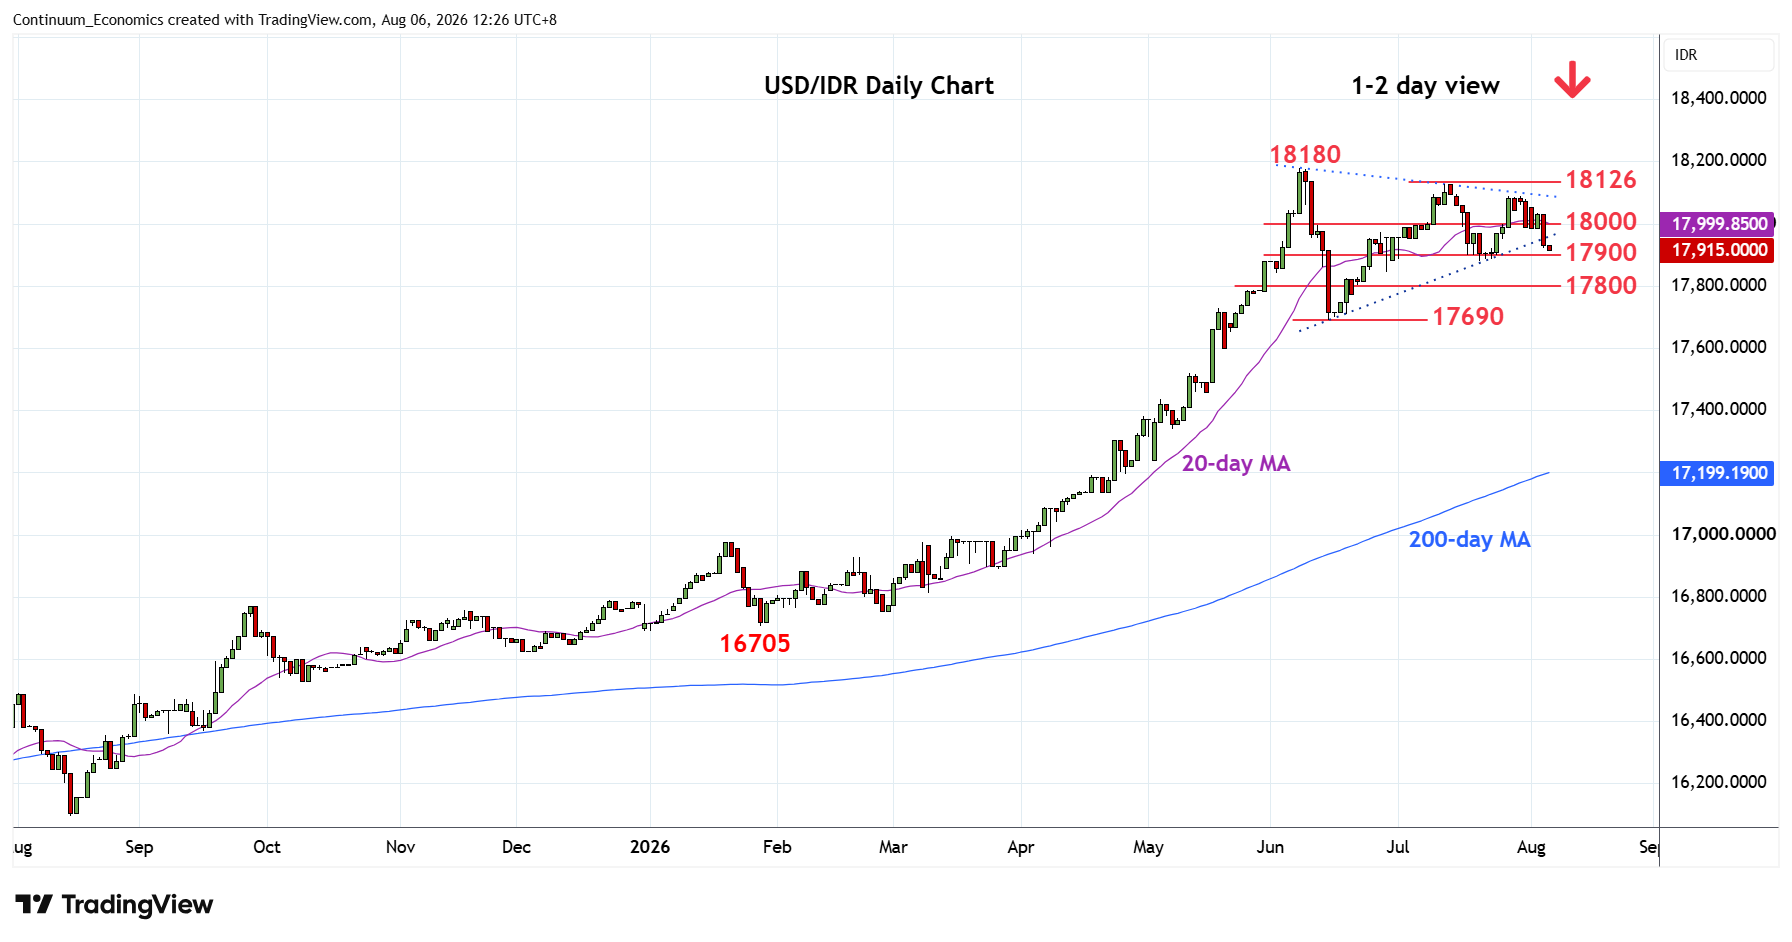
Under pressure as prices extend pullback from the 18090 high of last week
| Levels | Imp | Comment | Levels | Imp | Comment | |||
|---|---|---|---|---|---|---|---|---|
| R4 | 18180 | ** | 8 Jun all-time high | S1 | 17880 | ** | 21 Jul low | |
| R3 | 18126 | ** | 13 Jun high | S2 | 17845 | * | 29 Jun low | |
| R2 | 18090 | * | 28 Jul high | S3 | 17800 | * | congestion | |
| R1 | 18000 | * | congestion | S4 | 17690 | ** | Jun low |
Asterisk denotes strength of level
04:25 GMT - Under pressure as prices extend pullback from the 18090 high of last week. Breakdown from the triangle support turn focus to the 17900/17880, July lows. Below here will open up room for deeper pullback to 17800 support then the 17690, June low. Would expect reaction at the latter but a later break will extend the broader losses from the 18180 all-time high. Meanwhile, resistance at the 18000 level is expected to cap and sustain losses from the 18090 and 18126 lower highs.