Published: 2026-06-24T02:17:41.000Z
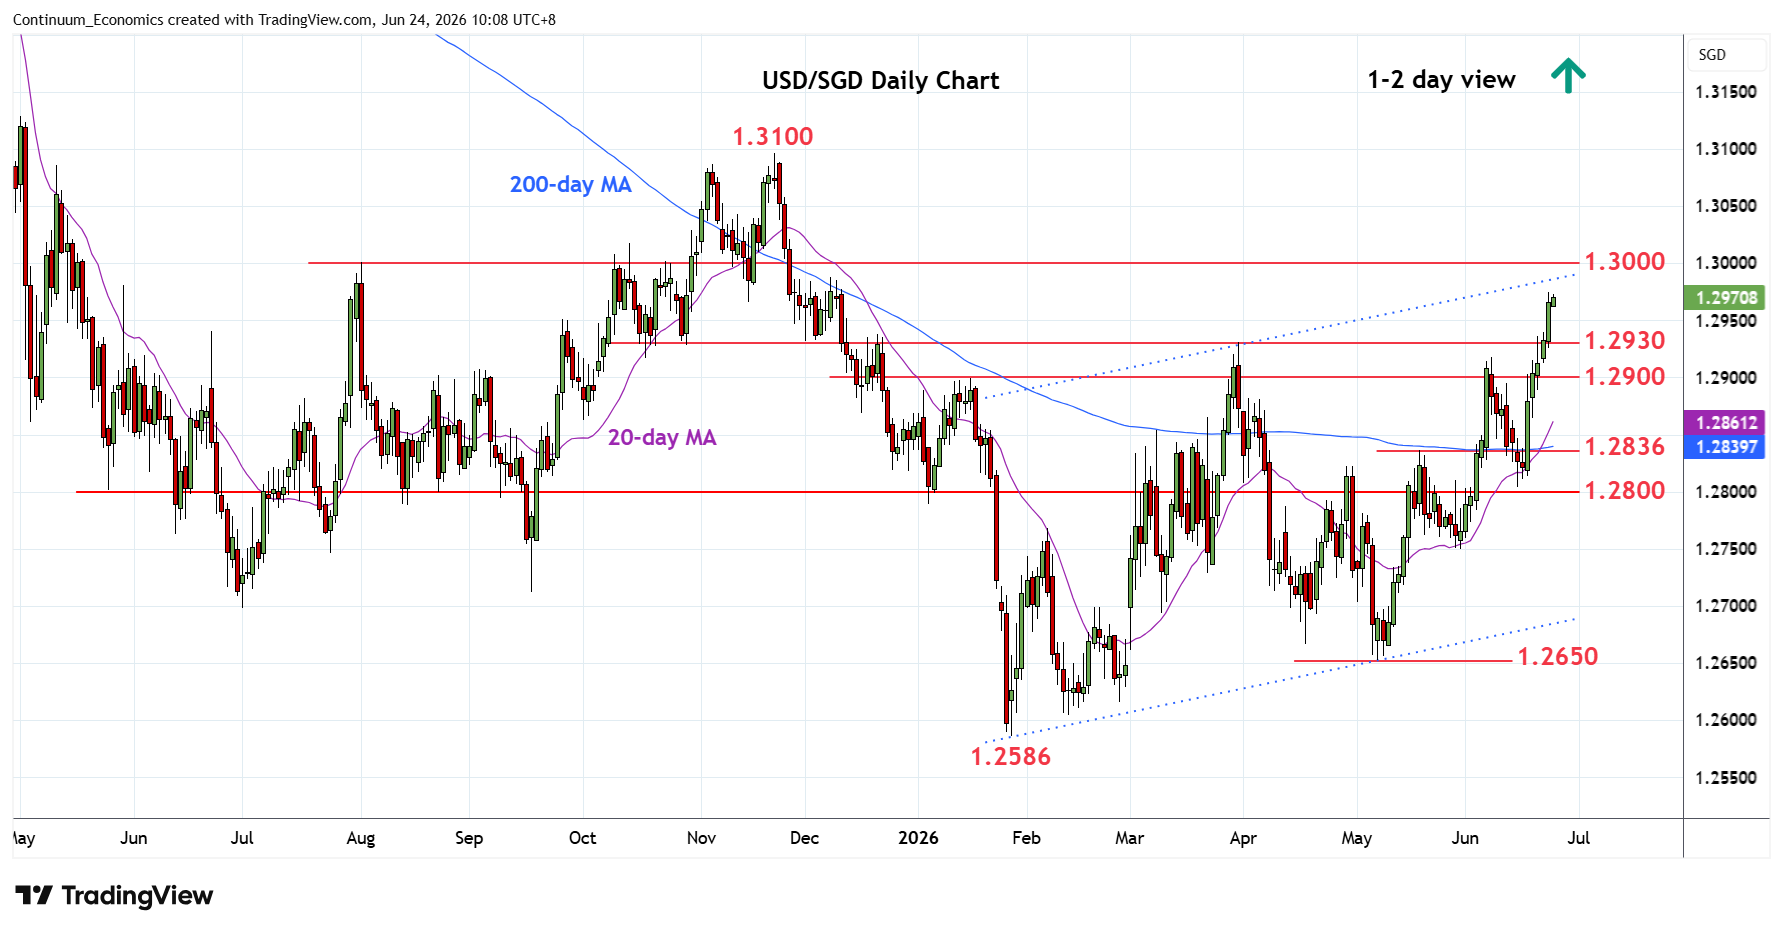
Chart USD/SGD Update: Extending gains, but stretched
-
Break above the 1.2900/30 area see prices extending gains from the January year low to reach 1.2975, 76.4% Fibonacci retracement
| Level | Comment | Level | Comment | ||||
|---|---|---|---|---|---|---|---|
| R4 | 1.3050 | * | congestion | S1 | 1.2930 | * | Mar high |
| R3 | 1.3000 | ** | figure, congestion | S2 | 1.2900 | * | congestion |
| R2 | 1.2985 | ** | Dec high, channel | S3 | 1.2850/36 | ** | congestion, May high |
| R1 | 1.2975 | * | 76.4% Nov/Jan fall | S4 | 1.2805/00 | ** | 15 Jun low, congestion |
Asterisk denotes strength of level
02:15 GMT - Break above strong resistance at the 1.2900/30 area see prices extending gains from the January year low to reach 1.2975, 76.4% Fibonacci retracement. Higher will see room to 1.2985 channel resistance from the January low and the 1.3000 figure. Would expect reaction at this area to unwind the stretched intraday and daily studies. Meanwhile, support is raised to the 1.2930/1.2900 area which should underpin. Would take break here to ease the upside pressure and see room for deeper pullback to strong support at the 1.2850/36 congestion and May high.