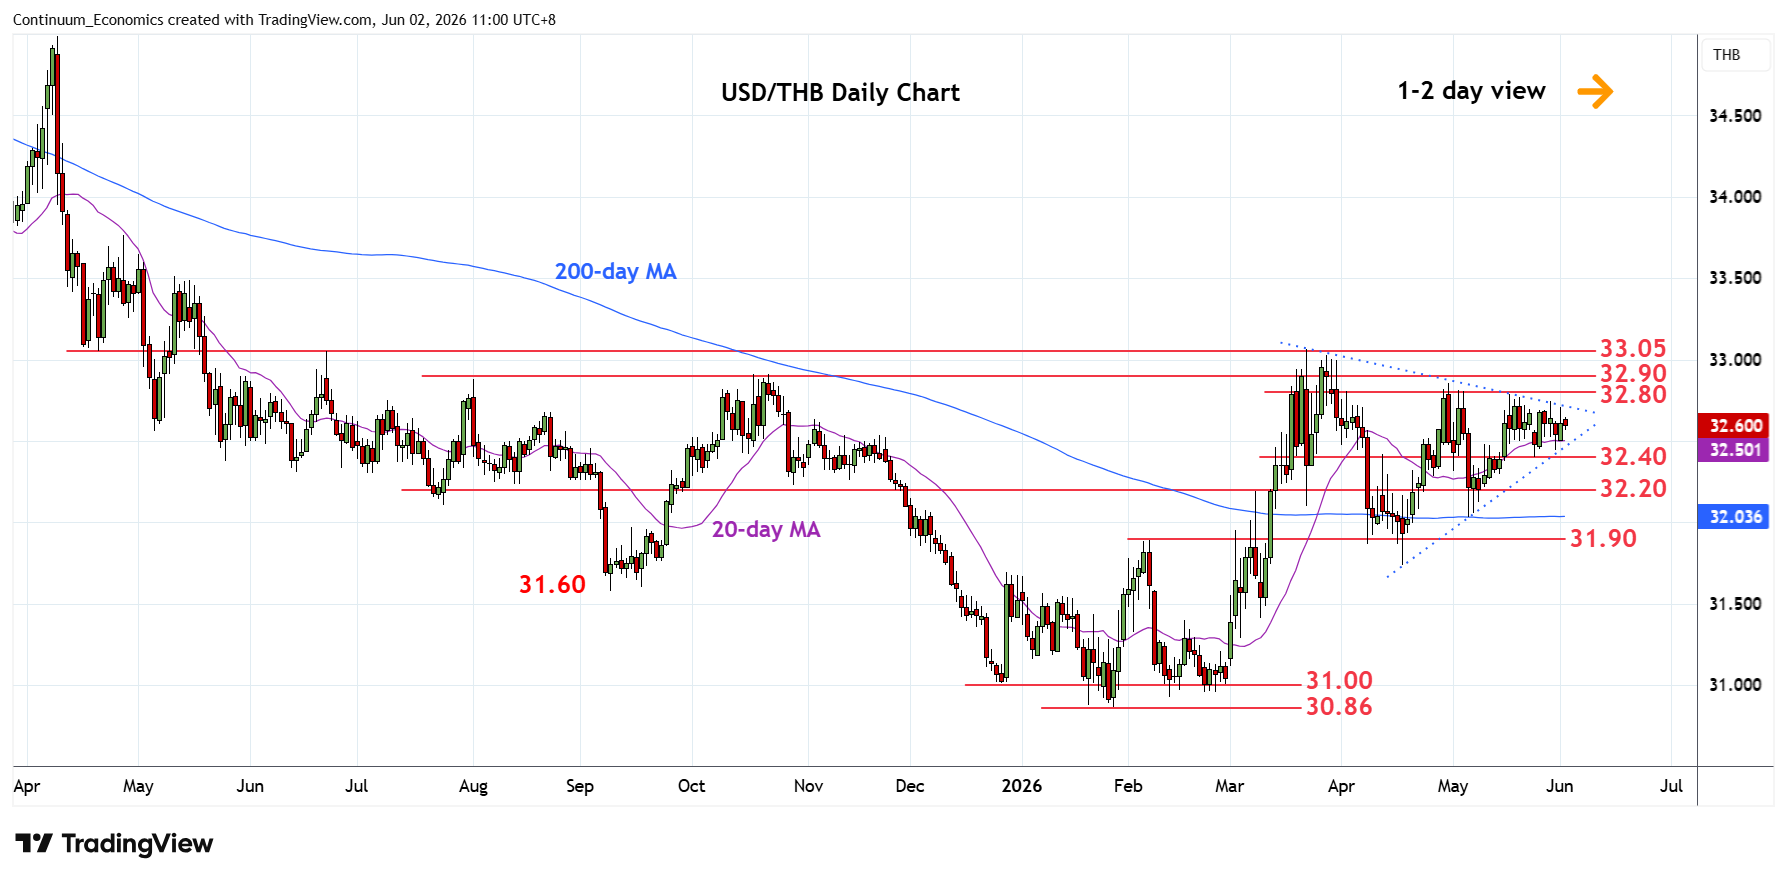
Chart USD/THB Update: Ranging within 32.80/32.40 area
Little change, as prices extend consolidation around 32.60 and within a 10-week triangle from the 33.05, March YTD high
| Level | Comment | Level | Comment | |||||
|---|---|---|---|---|---|---|---|---|
| R4 | 33.20 | * | congestion | S1 | 32.50/40 | ** | congestion | |
| R3 | 33.05 | ** | 23 Mar YTD high | S2 | 32.20 | * | congestion | |
| R2 | 32.90 | * | Oct high | S3 | 32.03 | ** | 6 May low | |
| R1 | 32.80/85 | ** | congestion, 30 Apr high | S4 | 31.90 | * | Feb high |
Asterisk denotes strength of level
03:15 GMT - Little change, as prices extend consolidation around 32.60 and within a 10-week triangle from the 33.05, March YTD high. Would take break of the 32.80/32.40 range area to set clearer trend. Above the 32.80 resistance will open up room for retest of strong resistance at 32.90 then the 33.05 high. Clearance here will confirm a 9-month bottom pattern at the January YTD low and see strong gains to retrace losses from the 2023/2024 year highs. Would take break of the 32.40 support to fade the upside pressure and open up room for deeper pullback to the 32.20 support and 32.03, May low.