Published: 2026-07-08T03:10:43.000Z
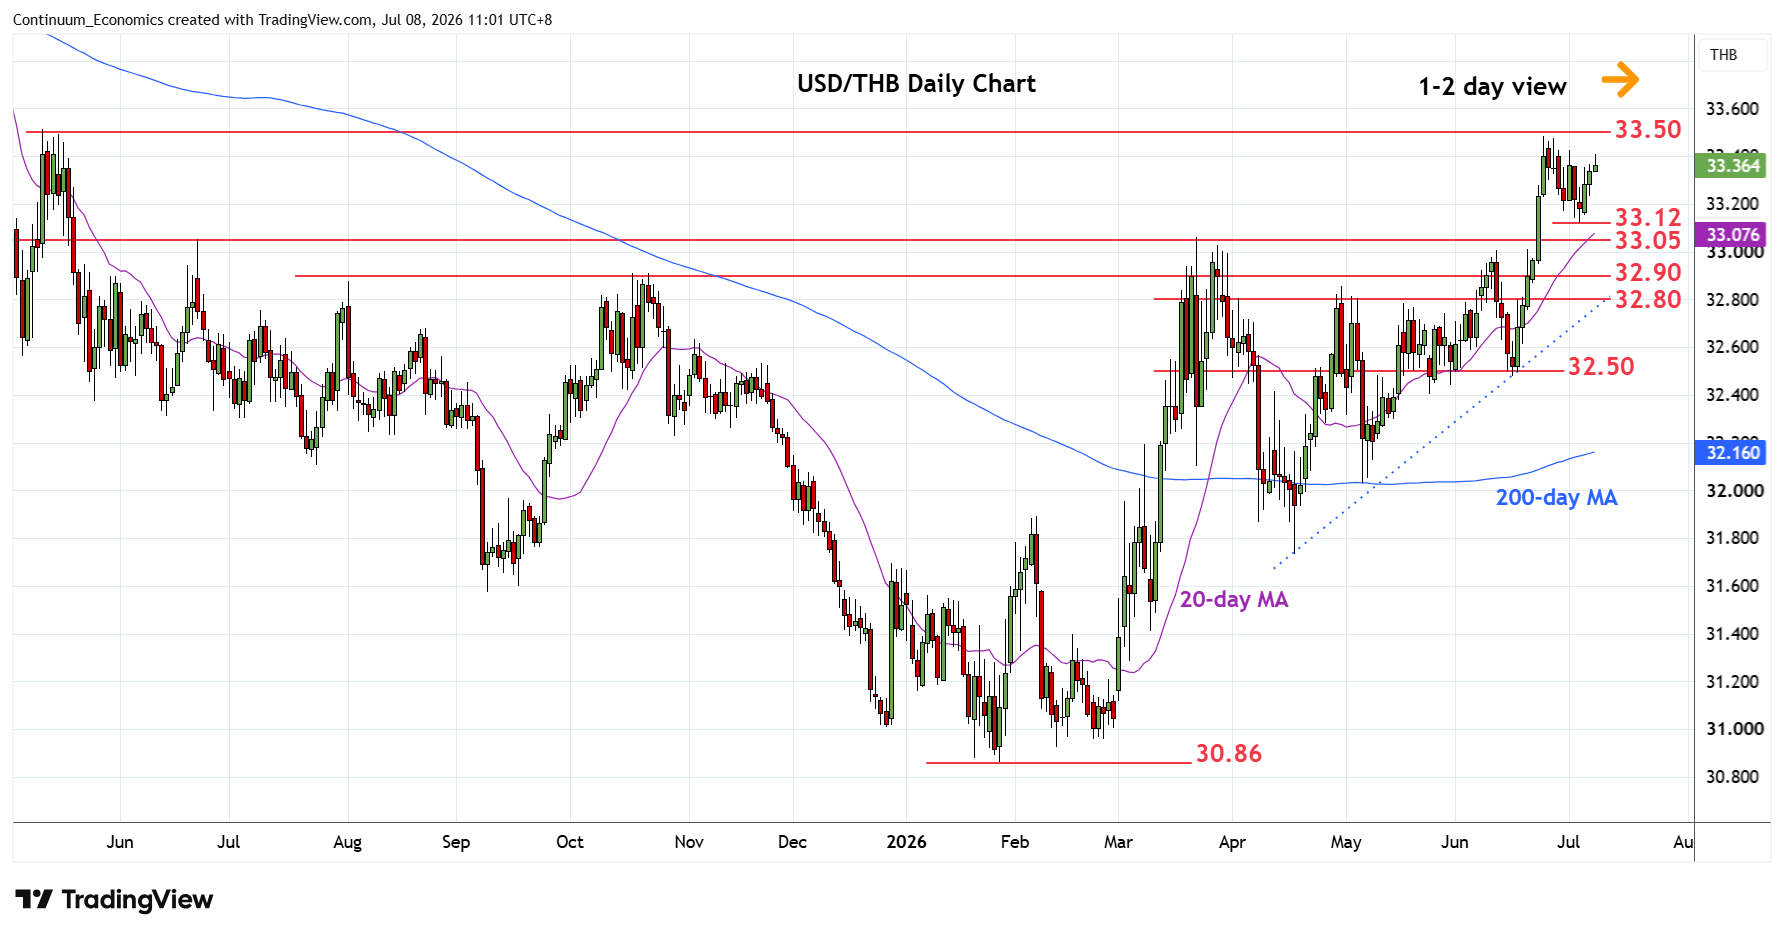
Chart USD/THB Update: Poised for retest of 33.48 high
1
Turned up from the 33.12 low of last Friday as prices consolidate losses from the 33.48 June current year high
| Level | Comment | Level | Comment | |||||
|---|---|---|---|---|---|---|---|---|
| R4 | 33.77 | * | 28 Apr 2025 high | S1 | 33.12 | * | 3 Jul low | |
| R3 | 33.50 | * | congestion | S2 | 33.05 | ** | Mar high | |
| R2 | 33.48 | ** | 24 Jun YTD high | S3 | 32.90 | * | Oct high | |
| R1 | 33.40 | congestion | S4 | 32.80 | ** | May high, congestion |
Asterisk denotes strength of level
03:00 GMT - Turned up from the 33.12 low of last Friday as prices consolidate losses from the 33.48 June current year high. Bounce see scope for retest of the 33.48 high where reaction can be expected. However, a later break cannot be ruled out to retrace losses from the April 2025 year high to 33.50 congestion and 33.77 late-April 2025 high. Stretched weekly studies caution corrective pullback with support starting at the 33.20 congestion and extending to 33.12 low. Would take break here to open up room for deeper pullback to 33.05/33.00 area.