Published: 2026-05-25T03:08:27.000Z
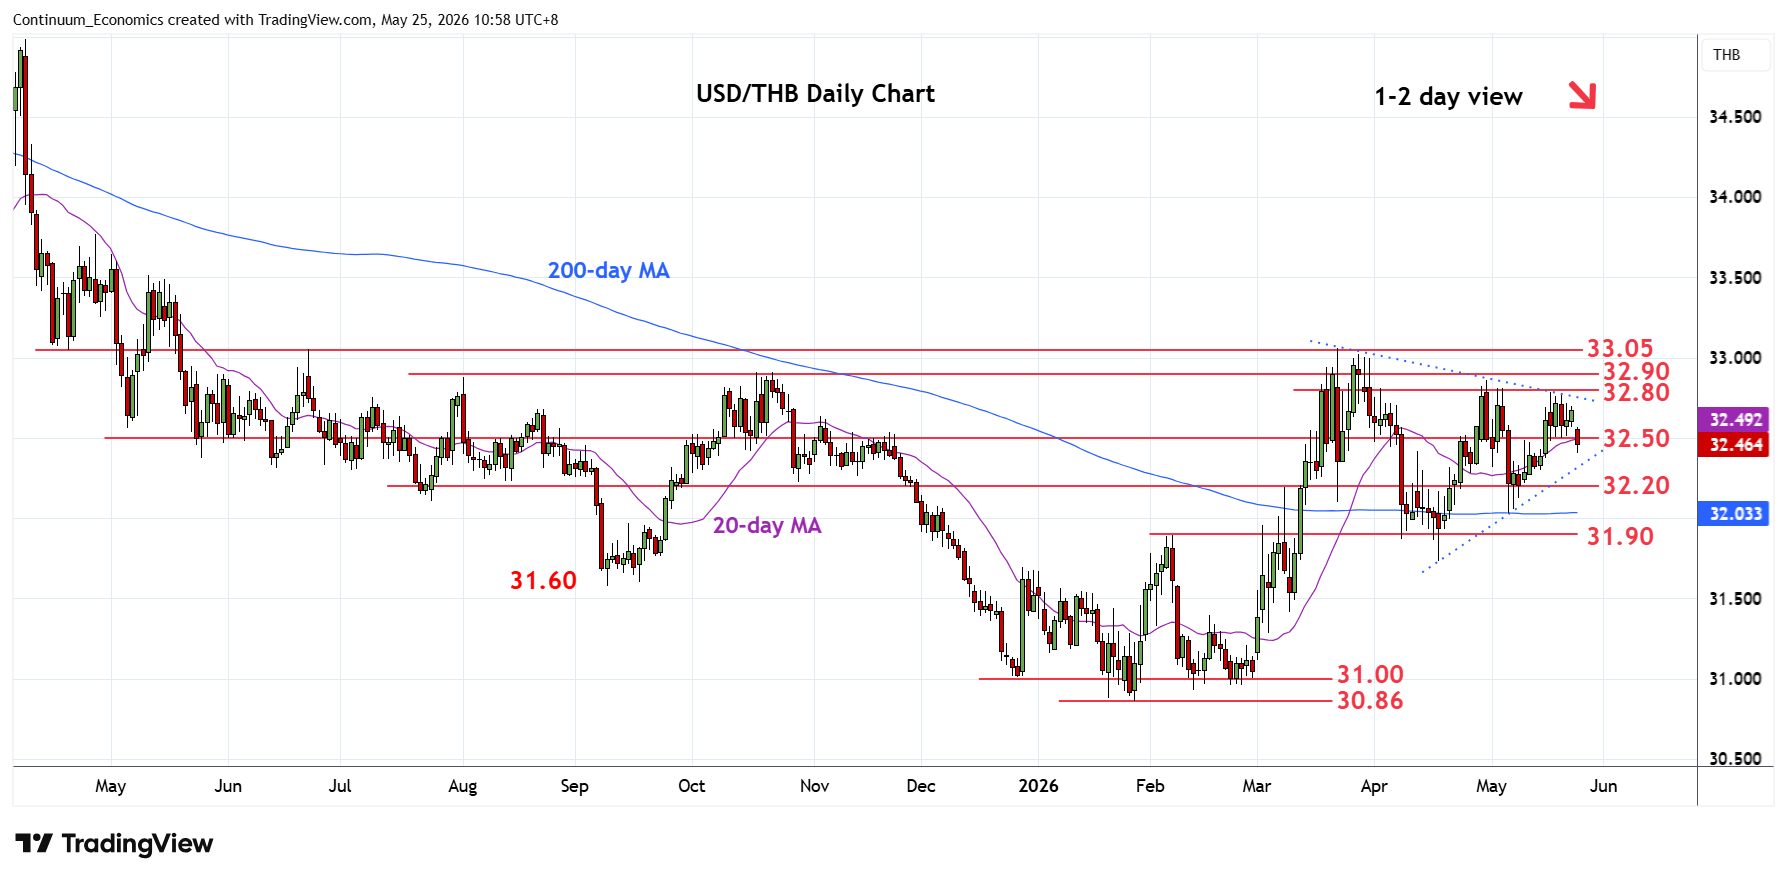
Chart USD/THB Update: Turning lower from 32.80/32.85 resistance
1
Weak opening see consolidation below the 32.80/85 resistance giving way to pullback to pressure support at the 32.50/32.40 area
| Level | Comment | Level | Comment | |||||
|---|---|---|---|---|---|---|---|---|
| R4 | 33.20 | * | congestion | S1 | 32.50/40 | ** | congestion | |
| R3 | 33.05 | ** | 23 Mar YTD high | S2 | 32.20 | * | congestion | |
| R2 | 32.90 | * | Oct high | S3 | 32.03 | ** | 6 May low | |
| R1 | 32.80/85 | ** | congestion, 30 Apr high | S4 | 31.90 | * | Feb high |
Asterisk denotes strength of level
03:00 GMT - Weak opening see consolidation below the 32.80/85 resistance last week giving way to pullback to pressure support at the 32.50/32.40 area. Below this will return focus to the downside and see room for pullback to support at 32.20 congestion. Lower still, will turn focus to the 32.03/00 low and congestion area. Break of the latter will expose support at 31.90/31.80 congestion to retest. Meanwhile, resistance is lowered to 32.60 congestion which is extend to cap and sustain rejection from the 32.80/32.85 resistance.