Published: 2026-05-21T02:06:17.000Z
Chart USD/SGD Update: Sharp rejection from 1.2823/40 resistance
1
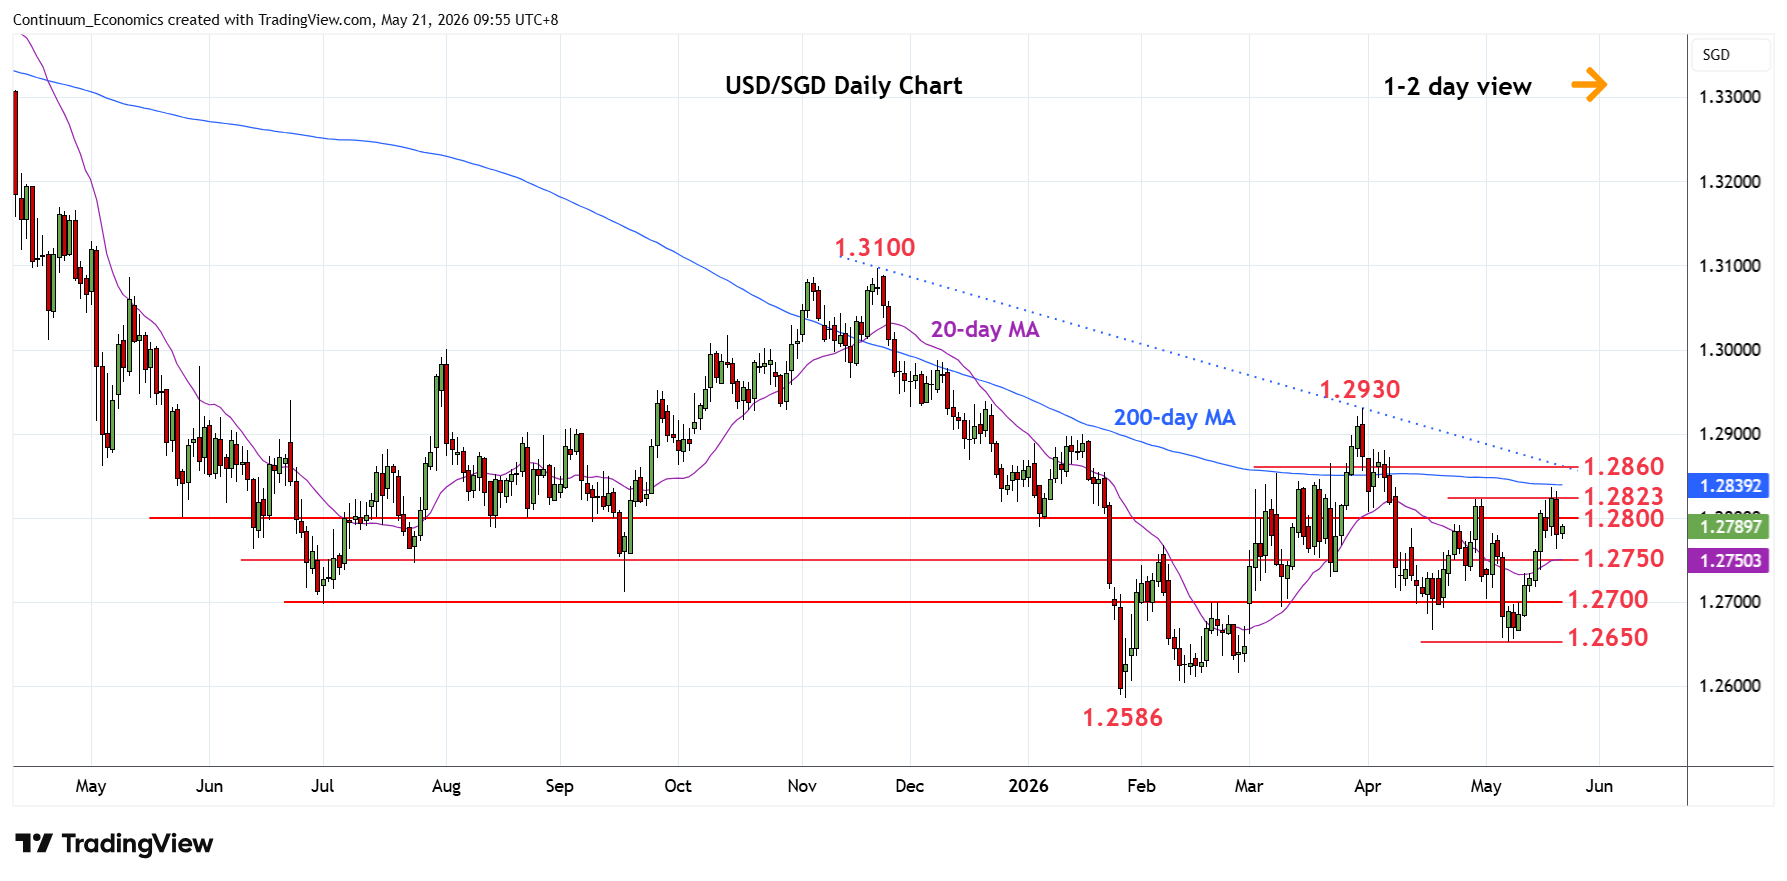
Test of resistance at the 1.2823/40 high of 29 April and 200-day MA has given way to selling pressure through the 1.2800 level
| Level | Comment | Level | Comment | ||||
|---|---|---|---|---|---|---|---|
| R4 | 1.2900 | * | congestion | S1 | 1.2750 | * | congestion |
| R3 | 1.2860 | ** | Nov trendline | S2 | 1.2735 | * | 13 May high |
| R2 | 1.2840 | * | 200-day MA | S3 | 1.2700 | ** | congestion |
| R1 | 1.2823 | * | 29 Apr high | S4 | 1.2650 | ** | 7 May low |
Asterisk denotes strength of level
02:00 GMT - Test of resistance at the 1.2823/40 high of 29 April and 200-day MA has given way to selling pressure through the 1.2800 level. Daily studies have turned down from overbought areas and suggest scope for deeper pullback to support at the 1.2750/35 congestion area. Break here will return focus to the downside for retest of the 1.2700 level and 1.2650, 7 May low. Meanwhile, resistance is lowered to the 1.2800 level is expected to cap and sustain rejection from the 1.2823/40 resistance and 200-day MA.