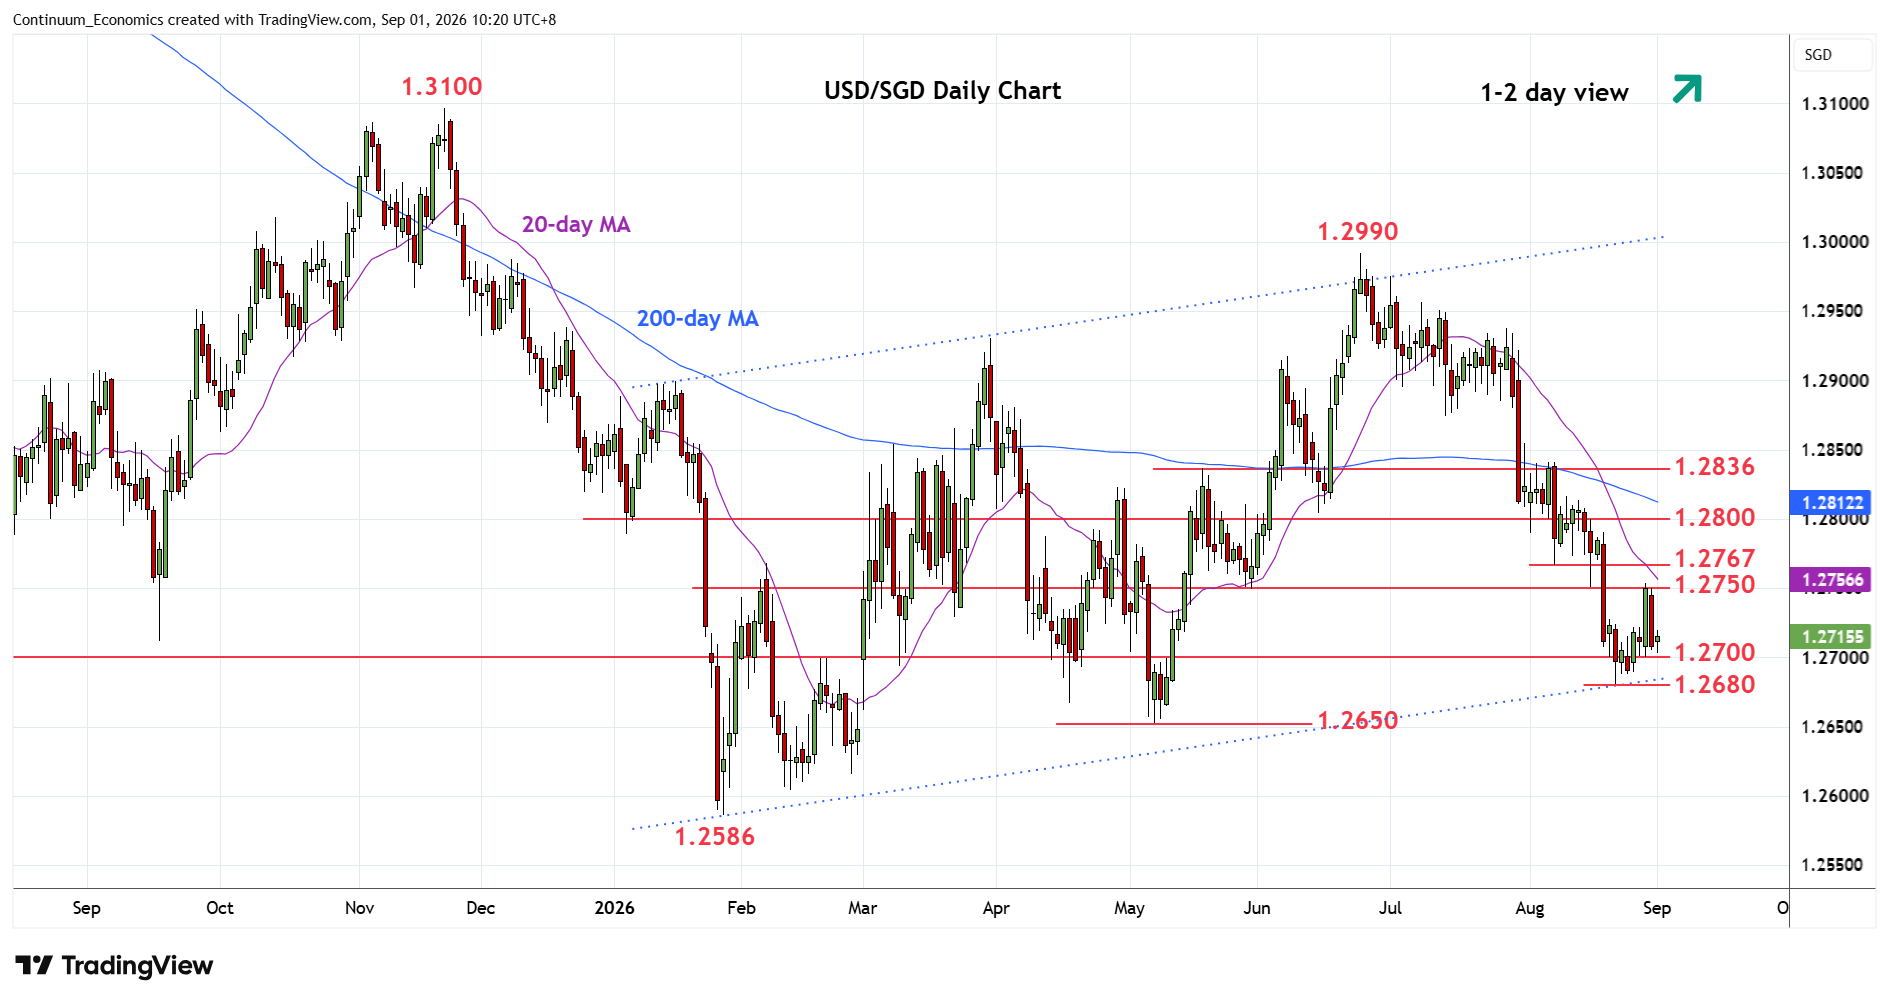
Chart USD/SGD Update: Choppy within 1.2700/50 area
Settled back from test of strong resistance at the 1.2750/67 area as prices consolidate bounce from the 1.2680 low
| Level | Comment | Level | Comment | ||||
|---|---|---|---|---|---|---|---|
| R4 | 1.2850 | * | congestion | S1 | 1.2700 | congestion | |
| R3 | 1.2836 | ** | May high | S2 | 1.2680 | * | 21 Aug low |
| R2 | 1.2800 | * | congestion | S3 | 1.2650 | ** | May low |
| R1 | 1.2750/67 | * | congestion, 7 Aug low | S4 | 1.2586 | ** | 28 Jan YTD low |
Asterisk denotes strength of level
02:30 GMT - Settled back from test of strong resistance at the 1.2750/67 area as prices consolidate bounce from the 1.2680 low. Daily studies are unwinding oversold daily studies and see room for stronger gains to retrace losses from the 1.2990, June current year high. Would take break above resistance at the 1.2750/1.2767 area to open up room for stronger gains to the 1.2800 congestion and 1.2836, May high. Corrective gains are expected to give way to fresh selling pressure later for retest of the 1.2700 level and 1.2680 low. Break here will see room for extension to the May low at 1.2650 and 1.2586, January current year low.