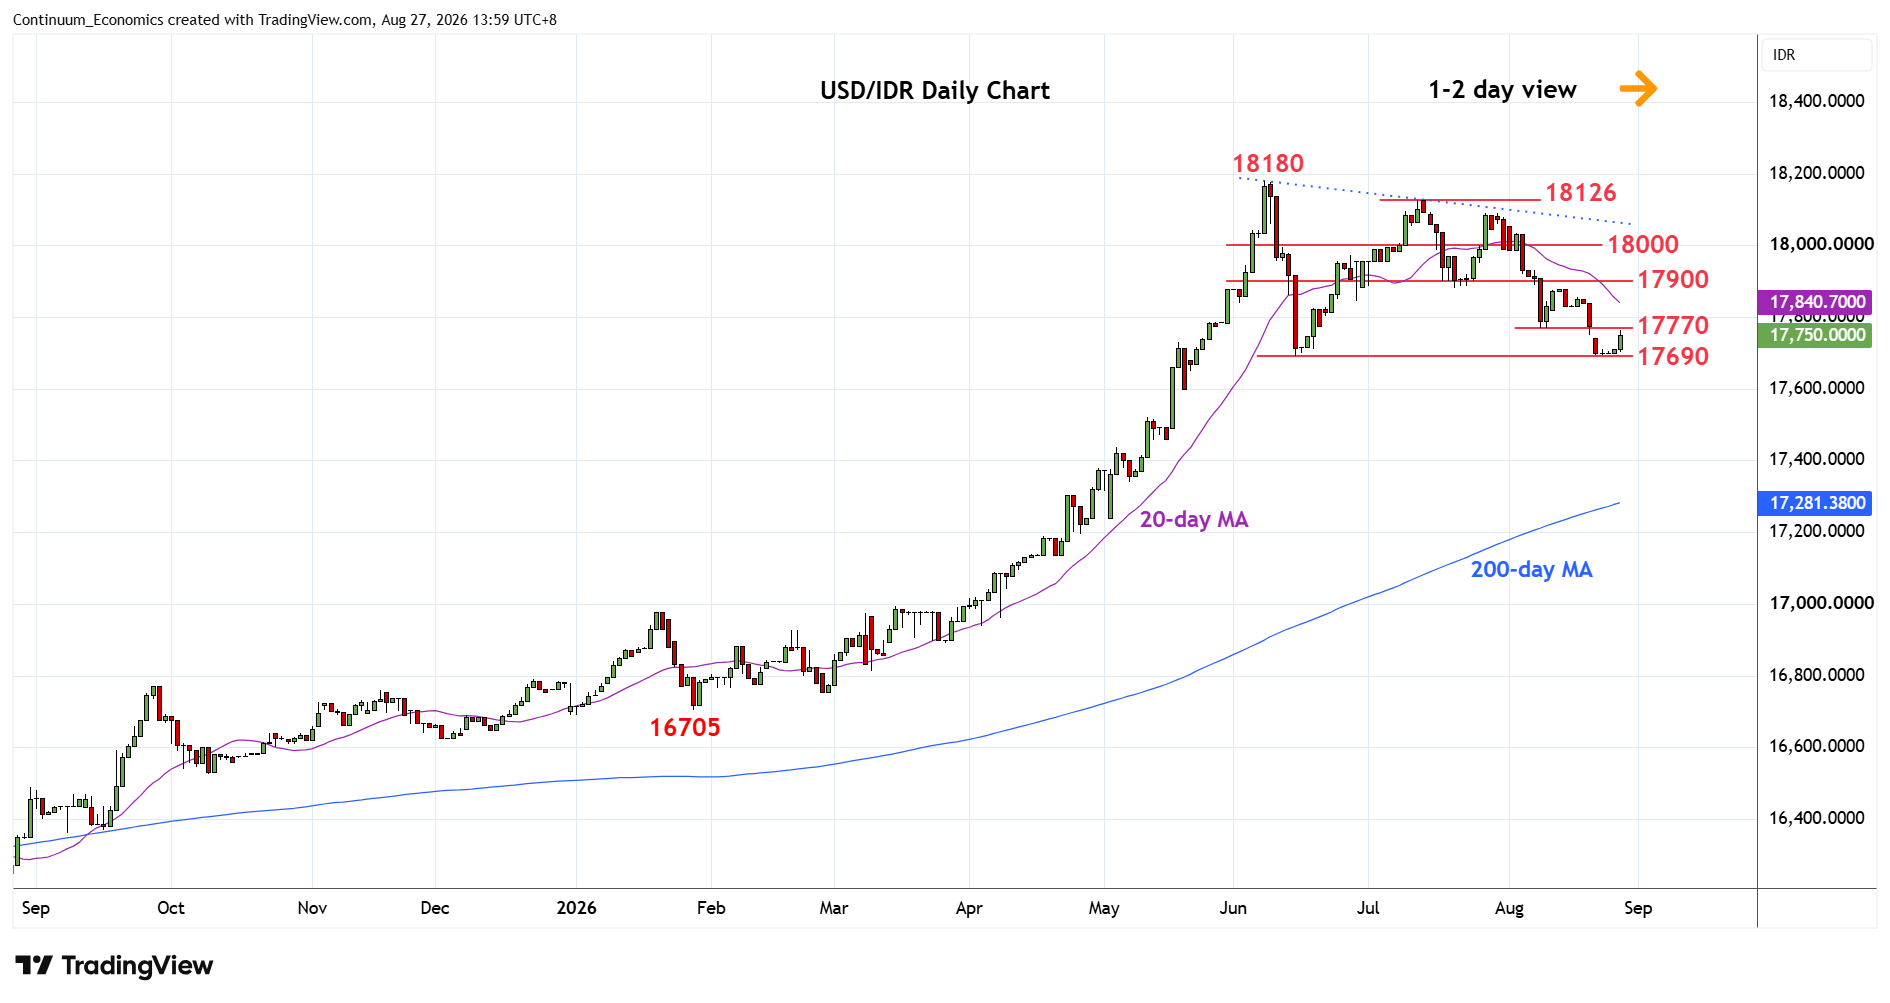
Chart USD/IDR Updates: Consolidating test of 17690 support
Turned up from support at the 17700/17690 June lows as prices consolidate losses from the 18126 high of July
| Levels | Imp | Comment | Levels | Imp | Comment | |||
|---|---|---|---|---|---|---|---|---|
| R4 | 18126 | ** | 13 Jun high | S1 | 17690 | ** | Jun low | |
| R3 | 18000 | * | congestion | S2 | 17600 | * | 20 May low | |
| R2 | 17880/900 | ** | Jul low, congestion | S3 | 17520 | * | 12 May high | |
| R1 | 17770 | * | 10 Aug low | S4 | 17385 | * | 38.2% 2025/2026 rally |
Asterisk denotes strength of level
06:00 GMT - Turned up from support at the 17700/17690 June lows as prices consolidate losses from the 18126 high of July. Bounce here see prices unwinding oversold daily studies with resistance starting at the 17770/17800 area. Break above here, if seen, will ease bearish pressure and open up room for stronger bounce to 17880/17900 previous lows which is expected to cap. Corrective bounce expected to give way to renewed selling pressure later. Break of the 17690 support will see deeper pullback to retrace gains from the August 2025 year low to support at the 17600/17520 area. Lower still, will see room to 17385, 38.2% Fibonacci retracement level.